169
Annex tables
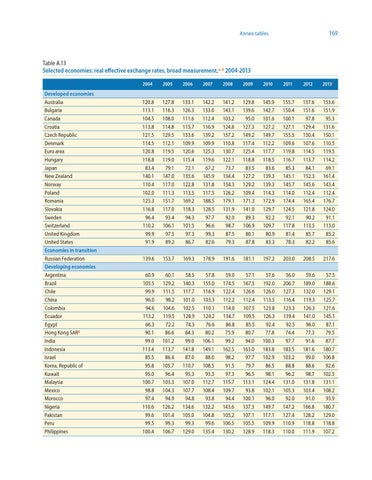
Table A.13 Selected economies: real effective exchange rates, broad measurement,a, b 2004-2013 2004
2005
2006
2007
2008
2009
2010
2011
2012
2013c
Australia
120.8
127.8
133.1
142.2
141.2
129.8
145.9
155.7
157.6
153.6
Bulgaria
113.1
116.3
126.3
133.0
143.1
139.6
142.7
150.4
151.6
151.9
Canada
104.5
108.0
111.6
112.4
103.2
95.0
101.6
100.1
97.8
95.3
Croatia
113.8
114.8
115.7
116.9
124.8
127.3
127.2
127.1
129.4
131.6
Czech Republic
121.5
129.5
133.6
139.2
157.2
149.2
149.7
155.5
150.4
150.1
Denmark
114.5
112.1
109.9
109.9
110.8
117.4
112.2
109.6
107.6
110.5
Euro area
120.8
119.5
120.6
125.3
130.7
125.4
117.7
119.8
114.5
119.5
Hungary
118.8
119.0
115.4
119.6
122.1
118.8
118.5
116.7
113.7
114.2
83.4
79.1
72.1
67.2
73.7
83.5
83.6
85.3
84.1
69.1
New Zealand
140.1
147.0
135.6
145.9
134.4
127.2
139.3
145.1
152.3
161.4
Norway
110.4
117.0
122.8
131.8
134.3
129.2
139.3
145.7
145.6
143.4
Poland
102.0
111.3
113.5
117.5
126.2
109.4
114.3
114.0
112.4
112.4
Romania
125.3
151.7
169.2
188.5
179.1
171.3
172.9
174.4
165.4
176.7
Slovakia
116.8
117.0
118.3
128.5
131.9
141.0
129.7
124.5
121.8
124.0
Developed economies
Japan
Sweden
96.4
93.4
94.3
97.7
92.0
89.3
92.2
92.1
90.2
91.1
110.2
106.1
101.5
96.6
98.7
106.9
109.7
117.8
113.5
113.0
United Kingdom
99.9
97.5
97.3
99.3
87.5
80.1
80.9
81.4
85.7
85.2
United States
91.9
89.2
86.7
82.6
79.3
87.8
83.3
78.3
82.2
85.6
139.6
153.7
169.3
178.9
191.6
181.1
197.2
203.0
208.5
217.6
60.9
60.1
58.5
57.8
59.0
57.1
57.6
56.0
59.6
57.5
Brazil
105.5
129.2
140.3
155.0
174.5
167.5
192.0
206.7
189.0
188.6
Chile
99.9
111.5
117.7
116.9
122.4
126.6
126.0
127.3
132.0
129.1
China
96.0
98.2
101.0
103.3
112.2
112.4
113.5
116.4
119.3
125.7
Colombia
94.6
104.6
102.5
110.1
114.0
107.5
123.8
123.3
126.3
121.6
Ecuador
113.2
119.5
128.9
124.2
134.7
109.5
126.3
139.4
141.0
145.1
Switzerland
Economies in transition Russian Federation Developing economies Argentina
Egypt
66.3
72.2
74.3
76.6
86.8
85.5
92.4
92.5
96.0
87.1
Hong Kong SARd
90.1
86.6
84.3
80.2
75.9
80.7
77.8
74.4
77.3
79.5
India
99.0
101.2
99.0
106.1
99.2
94.0
100.3
97.7
91.6
87.7
Indonesia
113.4
113.7
141.8
149.1
162.5
163.0
183.8
183.5
181.6
180.7
Israel
85.5
86.4
87.0
88.0
98.2
97.7
102.9
103.2
99.0
106.8
Korea, Republic of
95.8
105.7
110.7
108.5
91.5
79.7
86.5
88.8
88.6
92.6
Kuwait
95.0
96.4
95.3
93.3
97.3
96.5
98.1
96.2
98.7
102.5
Malaysia
100.7
103.3
107.0
112.7
115.7
113.1
124.4
131.0
131.8
131.1
Mexico
98.8
104.3
107.7
108.4
109.7
93.8
102.1
105.3
103.4
108.2
Morocco
97.4
94.9
94.8
93.8
94.4
100.1
96.0
92.0
91.0
93.9
Nigeria
110.6
126.2
134.6
132.2
143.6
137.3
149.7
147.2
166.8
180.7
Pakistan
99.6
101.4
105.0
104.8
105.2
107.1
117.1
127.4
128.2
129.0
Peru
99.5
99.3
99.3
99.6
106.5
105.5
109.9
110.9
118.8
118.8
100.4
106.7
129.0
135.4
130.2
128.9
118.3
110.0
111.9
107.2
Philippines