168
World Economic Situation and Prospects 2014
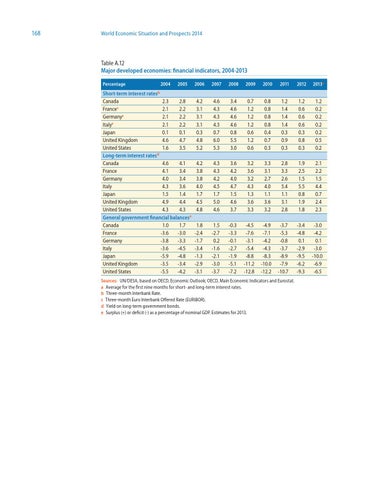
Table A.12 Major developed economies: financial indicators, 2004-2013 Percentage
2004
2005
Short-term interest ratesb Canada 2.3 2.8 2.1 2.2 Francec 2.1 2.2 Germanyc 2.1 2.2 Italyc Japan 0.1 0.1 United Kingdom 4.6 4.7 United States 1.6 3.5 Long-term interest ratesd Canada 4.6 4.1 France 4.1 3.4 Germany 4.0 3.4 Italy 4.3 3.6 Japan 1.5 1.4 United Kingdom 4.9 4.4 United States 4.3 4.3 General government financial balancese Canada 1.0 1.7 France -3.6 -3.0 Germany -3.8 -3.3 Italy -3.6 -4.5 Japan -5.9 -4.8 United Kingdom -3.5 -3.4 United States -5.5 -4.2
2006
2007
2008
2009
2010
2011
2012
2013a
4.2 3.1 3.1 3.1 0.3 4.8 5.2
4.6 4.3 4.3 4.3 0.7 6.0 5.3
3.4 4.6 4.6 4.6 0.8 5.5 3.0
0.7 1.2 1.2 1.2 0.6 1.2 0.6
0.8 0.8 0.8 0.8 0.4 0.7 0.3
1.2 1.4 1.4 1.4 0.3 0.9 0.3
1.2 0.6 0.6 0.6 0.3 0.8 0.3
1.2 0.2 0.2 0.2 0.2 0.5 0.2
4.2 3.8 3.8 4.0 1.7 4.5 4.8
4.3 4.3 4.2 4.5 1.7 5.0 4.6
3.6 4.2 4.0 4.7 1.5 4.6 3.7
3.2 3.6 3.2 4.3 1.3 3.6 3.3
3.3 3.1 2.7 4.0 1.1 3.6 3.2
2.8 3.3 2.6 5.4 1.1 3.1 2.8
1.9 2.5 1.5 5.5 0.8 1.9 1.8
2.1 2.2 1.5 4.4 0.7 2.4 2.3
1.8 -2.4 -1.7 -3.4 -1.3 -2.9 -3.1
1.5 -2.7 0.2 -1.6 -2.1 -3.0 -3.7
-0.3 -3.3 -0.1 -2.7 -1.9 -5.1 -7.2
-4.5 -7.6 -3.1 -5.4 -8.8 -11.2 -12.8
-4.9 -7.1 -4.2 -4.3 -8.3 -10.0 -12.2
-3.7 -5.3 -0.8 -3.7 -8.9 -7.9 -10.7
-3.4 -4.8 0.1 -2.9 -9.5 -6.2 -9.3
-3.0 -4.2 0.1 -3.0 -10.0 -6.9 -6.5
Sources: UN/DESA, based on OECD, Economic Outlook; OECD, Main Economic Indicators and Eurostat. a Average for the first nine months for short- and long-term interest rates. b Three-month Interbank Rate. c Three-month Euro Interbank Offered Rate (EURIBOR). d Yield on long-term government bonds. e Surplus (+) or deficit (-) as a percentage of nominal GDP. Estimates for 2013.