167
Annex tables
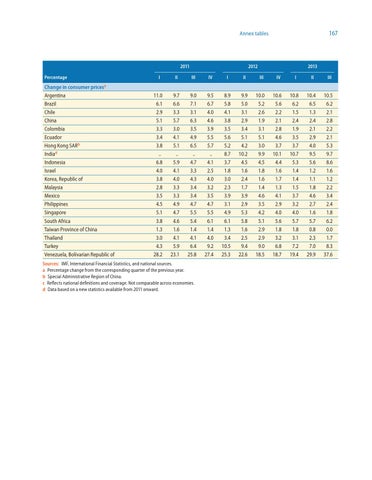
2011 Percentage
2012
2013
I
II
III
IV
I
II
III
IV
I
II
III
11.0
9.7
9.0
9.5
8.9
9.9
10.0
10.6
10.8
10.4
10.5
Change in consumer pricesa Argentina Brazil
6.1
6.6
7.1
6.7
5.8
5.0
5.2
5.6
6.2
6.5
6.2
Chile
2.9
3.3
3.1
4.0
4.1
3.1
2.6
2.2
1.5
1.3
2.1
China
5.1
5.7
6.3
4.6
3.8
2.9
1.9
2.1
2.4
2.4
2.8
Colombia
3.3
3.0
3.5
3.9
3.5
3.4
3.1
2.8
1.9
2.1
2.2
Ecuador
3.4
4.1
4.9
5.5
5.6
5.1
5.1
4.6
3.5
2.9
2.1
Hong Kong SARb
3.8
5.1
6.5
5.7
5.2
4.2
3.0
3.7
3.7
4.0
5.3
..
..
..
..
8.7
10.2
9.9
10.1
10.7
9.5
9.7
Indiad Indonesia
6.8
5.9
4.7
4.1
3.7
4.5
4.5
4.4
5.3
5.6
8.6
Israel
4.0
4.1
3.3
2.5
1.8
1.6
1.8
1.6
1.4
1.2
1.6
Korea, Republic of
3.8
4.0
4.3
4.0
3.0
2.4
1.6
1.7
1.4
1.1
1.2
Malaysia
2.8
3.3
3.4
3.2
2.3
1.7
1.4
1.3
1.5
1.8
2.2
Mexico
3.5
3.3
3.4
3.5
3.9
3.9
4.6
4.1
3.7
4.6
3.4
Philippines
4.5
4.9
4.7
4.7
3.1
2.9
3.5
2.9
3.2
2.7
2.4
Singapore
5.1
4.7
5.5
5.5
4.9
5.3
4.2
4.0
4.0
1.6
1.8
South Africa
3.8
4.6
5.4
6.1
6.1
5.8
5.1
5.6
5.7
5.7
6.2
Taiwan Province of China
1.3
1.6
1.4
1.4
1.3
1.6
2.9
1.8
1.8
0.8
0.0
Thailand
3.0
4.1
4.1
4.0
3.4
2.5
2.9
3.2
3.1
2.3
1.7
Turkey
4.3
5.9
6.4
9.2
10.5
9.4
9.0
6.8
7.2
7.0
8.3
28.2
23.1
25.8
27.4
25.3
22.6
18.5
18.7
19.4
29.9
37.6
Venezuela, Bolivarian Republic of
Sources: IMF, International Financial Statistics, and national sources. a Percentage change from the corresponding quarter of the previous year. b Special Administrative Region of China. c Reflects national definitions and coverage. Not comparable across economies. d Data based on a new statistics available from 2011 onward.