165
Annex tables
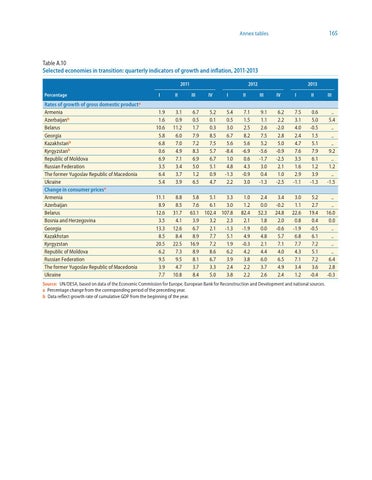
Table A.10 Selected economies in transition: quarterly indicators of growth and inflation, 2011-2013 2011 Percentage
I
II
1.9 1.6 10.6 5.8 6.8 0.6 6.9 3.5 6.4 5.4 11.1 8.9 12.6 3.5 13.3 8.5 20.5 6.2 9.5 3.9 7.7
2012 III
IV
3.1 0.9 11.2 6.0 7.0 4.9 7.1 3.4 3.7 3.9
6.7 0.5 1.7 7.9 7.2 8.3 6.9 5.0 1.2 6.5
5.2 0.1 0.3 8.5 7.5 5.7 6.7 5.1 0.9 4.7
8.8 8.5 31.7 4.1 12.6 8.4 22.5 7.3 9.5 4.7 10.8
5.8 7.6 63.1 3.9 6.7 8.9 16.9 8.9 8.1 3.7 8.4
5.1 6.1 102.4 3.2 2.1 7.7 7.2 8.6 6.7 3.3 5.0
I
2013
II
III
IV
5.4 0.5 3.0 6.7 5.6 -8.4 1.0 4.8 -1.3 2.2
7.1 1.5 2.5 8.2 5.6 -6.9 0.6 4.3 -0.9 3.0
9.1 1.1 2.6 7.5 5.2 -5.6 -1.7 3.0 0.4 -1.3
6.2 2.2 -2.0 2.8 5.0 -0.9 -2.5 2.1 1.0 -2.5
3.3 3.0 107.8 2.3 -1.3 5.1 1.9 6.2 3.9 2.4 3.8
1.0 1.2 82.4 2.1 -1.9 4.9 -0.3 4.2 3.8 2.2 2.2
2.4 0.0 52.3 1.8 0.0 4.8 2.1 4.4 6.0 3.7 2.6
3.4 -0.2 24.8 2.0 -0.6 5.7 7.1 4.0 6.5 4.9 2.4
I
II
III
7.5 3.1 4.0 2.4 4.7 7.6 3.5 1.6 2.9 -1.1
0.6 5.0 -0.5 1.5 5.1 7.9 6.1 1.2 3.9 -1.3
.. 5.4 .. .. .. 9.2 .. 1.2 .. -1.5
3.0 1.1 22.6 0.8 -1.9 6.8 7.7 4.3 7.1 3.4 1.2
5.2 2.7 19.4 0.4 -0.5 6.1 7.2 5.1 7.2 3.6 -0.4
.. .. 16.0 0.0 .. .. .. .. 6.4 2.8 -0.3
Rates of growth of gross domestic producta Armenia Azerbaijanb Belarus Georgia Kazakhstanb Kyrgyzstanb Republic of Moldova Russian Federation The former Yugoslav Republic of Macedonia Ukraine Change in consumer pricesa Armenia Azerbaijan Belarus Bosnia and Herzegovina Georgia Kazakhstan Kyrgyzstan Republic of Moldova Russian Federation The former Yugoslav Republic of Macedonia Ukraine
Source: UN/DESA, based on data of the Economic Commission for Europe, European Bank for Reconstruction and Development and national sources. a Percentage change from the corresponding period of the preceding year. b Data reflect growth rate of cumulative GDP from the beginning of the year.