164
World Economic Situation and Prospects 2014
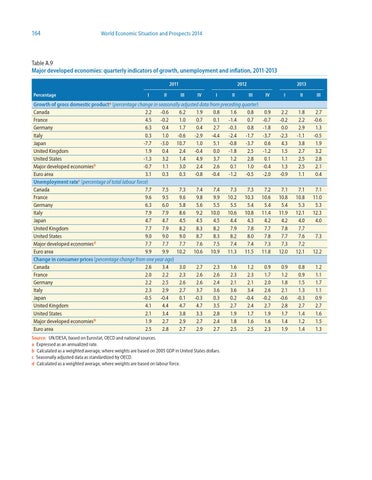
Table A.9 Major developed economies: quarterly indicators of growth, unemployment and inflation, 2011-2013 2011 Percentage
I
II
2012 III
IV
I
II
2013 III
IV
I
II
III
Growth of gross domestic producta (percentage change in seasonally adjusted data from preceding quarter) Canada 2.2 -0.6 France 4.5 -0.2 Germany 6.3 0.4 Italy 0.3 1.0 Japan -7.7 -3.0 United Kingdom 1.9 0.4 United States -1.3 3.2 -0.7 1.1 Major developed economiesb Euro area 3.1 0.3 Unemployment ratec (percentage of total labour force) Canada 7.7 7.5 France 9.6 9.5 Germany 6.3 6.0 Italy 7.9 7.9 Japan 4.7 4.7 United Kingdom 7.7 7.9 United States 9.0 9.0 7.7 7.7 Major developed economiesd Euro area 9.9 9.9 Change in consumer prices (percentage change from one year ago) Canada 2.6 3.4 France 2.0 2.2 Germany 2.2 2.5 Italy 2.3 2.9 Japan -0.5 -0.4 United Kingdom 4.1 4.4 United States 2.1 3.4 1.9 2.7 Major developed economiesb Euro area 2.5 2.8
6.2 1.0 1.7 -0.6 10.7 2.4 1.4 3.0 0.3
1.9 0.7 0.4 -2.9 1.0 -0.4 4.9 2.4 -0.8
0.8 0.1 2.7 -4.4 5.1 0.0 3.7 2.6 -0.4
1.6 -1.4 -0.3 -2.4 -0.8 -1.8 1.2 0.1 -1.2
0.8 0.7 0.8 -1.7 -3.7 2.5 2.8 1.0 -0.5
0.9 -0.7 -1.8 -3.7 0.6 -1.2 0.1 -0.4 -2.0
2.2 -0.2 0.0 -2.3 4.3 1.5 1.1 1.3 -0.9
1.8 2.2 2.9 -1.1 3.8 2.7 2.5 2.5 1.1
2.7 -0.6 1.3 -0.5 1.9 3.2 2.8 2.1 0.4
7.3 9.6 5.8 8.6 4.5 8.2 9.0 7.7 10.2
7.4 9.8 5.6 9.2 4.5 8.3 8.7 7.6 10.6
7.4 9.9 5.5 10.0 4.5 8.2 8.3 7.5 10.9
7.3 10.2 5.5 10.6 4.4 7.9 8.2 7.4 11.3
7.3 10.3 5.4 10.8 4.3 7.8 8.0 7.4 11.5
7.2 10.6 5.4 11.4 4.2 7.7 7.8 7.3 11.8
7.1 10.8 5.4 11.9 4.2 7.8 7.7 7.3 12.0
7.1 10.8 5.3 12.1 4.0 7.7 7.6 7.2 12.1
7.1 11.0 5.3 12.3 4.0
3.0 2.3 2.6 2.7 0.1 4.7 3.8 2.9 2.7
2.7 2.6 2.6 3.7 -0.3 4.7 3.3 2.7 2.9
2.3 2.6 2.4 3.6 0.3 3.5 2.8 2.4 2.7
1.6 2.3 2.1 3.6 0.2 2.7 1.9 1.8 2.5
1.2 2.3 2.1 3.4 -0.4 2.4 1.7 1.6 2.5
0.9 1.7 2.0 2.6 -0.2 2.7 1.9 1.6 2.3
0.9 1.2 1.8 2.1 -0.6 2.8 1.7 1.4 1.9
0.8 0.9 1.5 1.3 -0.3 2.7 1.4 1.2 1.4
1.2 1.1 1.7 1.1 0.9 2.7 1.6 1.5 1.3
Source: UN/DESA, based on Eurostat, OECD and national sources. a Expressed as an annualized rate. b Calculated as a weighted average, where weights are based on 2005 GDP in United States dollars. c Seasonally adjusted data as standardized by OECD. d Calculated as a weighted average, where weights are based on labour force.
7.3 12.2