163
Annex tables
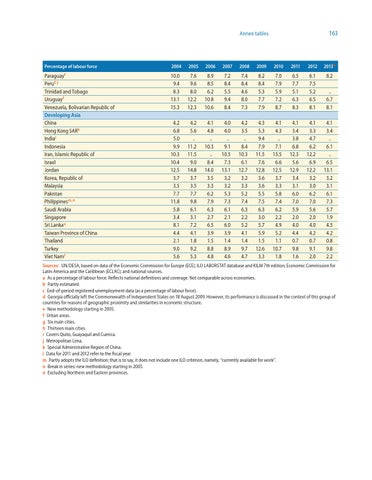
Percentage of labour force
2004
2005
2006
2007
2008
2009
2010
2011
2012
2013b
Paraguayf
10.0 9.4 8.3 13.1 15.3
7.6 9.6 8.0 12.2 12.3
8.9 8.5 6.2 10.8 10.6
7.2 8.4 5.5 9.4 8.4
7.4 8.4 4.6 8.0 7.3
8.2 8.4 5.3 7.7 7.9
7.0 7.9 5.9 7.2 8.7
6.5 7.7 5.1 6.3 8.3
6.1 7.5 5.2 6.5 8.1
8.2 .. 6.7 8.1
4.2 6.8 5.0 9.9 10.3 10.4 12.5 3.7 3.5 7.7 11.8 5.8 3.4 8.1 4.4 2.1 9.0 5.6
4.2 5.6 .. 11.2 11.5 9.0 14.8 3.7 3.5 7.7 9.8 6.1 3.1 7.2 4.1 1.8 9.2 5.3
4.1 4.8 .. 10.3 .. 8.4 14.0 3.5 3.3 6.2 7.9 6.3 2.7 6.5 3.9 1.5 8.8 4.8
4.0 4.0 .. 9.1 10.5 7.3 13.1 3.2 3.2 5.3 7.3 6.1 2.1 6.0 3.9 1.4 8.9 4.6
4.2 3.5 .. 8.4 10.3 6.1 12.7 3.2 3.3 5.2 7.4 6.3 2.2 5.2 4.1 1.4 9.7 4.7
4.3 5.3 9.4 7.9 11.5 7.6 12.8 3.6 3.6 5.5 7.5 6.3 3.0 5.7 5.9 1.5 12.6 3.3
4.1 4.3 .. 7.1 13.5 6.6 12.5 3.7 3.3 5.8 7.4 6.2 2.2 4.9 5.2 1.1 10.7 1.8
4.1 3.4 3.8 6.8 12.3 5.6 12.9 3.4 3.1 6.0 7.0 5.9 2.0 4.0 4.4 0.7 9.8 1.6
4.1 3.3 4.7 6.2 12.2 6.9 12.2 3.2 3.0 6.2 7.0 5.6 2.0 4.0 4.2 0.7 9.1 2.0
4.1 3.4 .. 6.1 .. 6.5 13.1 3.2 3.1 6.1 7.3 5.7 1.9 4.5 4.2 0.8 9.8 2.2
Peruf, j Trinidad and Tobago Uruguayf Venezuela, Bolivarian Republic of Developing Asia China Hong Kong SARk Indial Indonesia Iran, Islamic Republic of Israel Jordan Korea, Republic of Malaysia Pakistan Philippinesm, n Saudi Arabia Singapore Sri Lankao Taiwan Province of China Thailand Turkey Viet Namf
Sources: UN/DESA, based on data of the Economic Commission for Europe (ECE); ILO LABORSTAT database and KILM 7th edition; Economic Commission for Latin America and the Caribbean (ECLAC); and national sources. a As a percentage of labour force. Reflects national definitions and coverage. Not comparable across economies. b Partly estimated. c End-of-period registered unemployment data (as a percentage of labour force). d Georgia officially left the Commonwealth of Independent States on 18 August 2009. However, its performance is discussed in the context of this group of countries for reasons of geographic proximity and similarities in economic structure. e New methodology starting in 2005. f Urban areas. g Six main cities. h Thirteen main cities. i Covers Quito, Guayaquil and Cuenca. j Metropolitan Lima. k Special Administrative Region of China. l Data for 2011 and 2012 refer to the fiscal year. m Partly adopts the ILO definition; that is to say, it does not include one ILO criterion, namely, “currently available for work”. n Break in series: new methodology starting in 2005. o Excluding Northern and Eastern provinces.