161
Annex tables
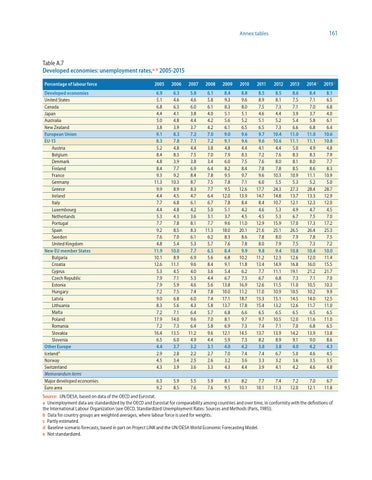
Table A.7 Developed economies: unemployment rates,a, b 2005-2015 Percentage of labour force
2005
2006
2007
2008
2009
2010
2011
2012
2013c
2014d
2015d
Developed economies United States Canada Japan Australia New Zealand European Union EU-15 Austria Belgium Denmark Finland France Germany Greece Ireland Italy Luxembourg Netherlands Portugal Spain Sweden United Kingdom New EU member States Bulgaria Croatia Cyprus Czech Republic Estonia Hungary Latvia Lithuania Malta Poland Romania Slovakia Slovenia Other Europe Icelande Norway Switzerland Memorandum items Major developed economies Euro area
6.9 5.1 6.8 4.4 5.0 3.8 9.1 8.3 5.2 8.4 4.8 8.4 9.3 11.3 9.9 4.4 7.7 4.4 5.3 7.7 9.2 7.6 4.8 11.9 10.1 12.6 5.3 7.9 7.9 7.2 9.0 8.3 7.2 17.9 7.2 16.4 6.5 4.4 2.9 4.5 4.3
6.3 4.6 6.3 4.1 4.8 3.9 8.3 7.8 4.8 8.3 3.9 7.7 9.2 10.3 8.9 4.5 6.8 4.8 4.3 7.8 8.5 7.0 5.4 10.0 8.9 11.1 4.5 7.1 5.9 7.5 6.8 5.6 7.1 14.0 7.3 13.5 6.0 3.7 2.8 3.4 3.9
5.8 4.6 6.0 3.8 4.4 3.7 7.2 7.1 4.4 7.5 3.8 6.9 8.4 8.7 8.3 4.7 6.1 4.2 3.6 8.1 8.3 6.1 5.3 7.7 6.9 9.6 4.0 5.3 4.6 7.4 6.0 4.3 6.4 9.6 6.4 11.2 4.9 3.2 2.2 2.5 3.6
6.1 5.8 6.1 4.0 4.2 4.2 7.0 7.2 3.8 7.0 3.4 6.4 7.8 7.5 7.7 6.4 6.7 5.0 3.1 7.7 11.3 6.2 5.7 6.5 5.6 8.4 3.6 4.4 5.6 7.8 7.4 5.8 5.7 7.0 5.8 9.6 4.4 3.1 2.7 2.6 3.3
8.4 9.3 8.3 5.1 5.6 6.1 9.0 9.1 4.8 7.9 6.0 8.2 9.5 7.8 9.5 12.0 7.8 5.1 3.7 9.6 18.0 8.3 7.6 8.4 6.8 9.1 5.4 6.7 13.8 10.0 17.1 13.7 6.8 8.1 6.9 12.1 5.9 4.0 7.0 3.2 4.3
8.8 9.6 8.0 5.1 5.2 6.5 9.6 9.6 4.4 8.3 7.5 8.4 9.7 7.1 12.6 13.9 8.4 4.2 4.5 11.0 20.1 8.6 7.8 9.9 10.2 11.8 6.2 7.3 16.9 11.2 18.7 17.8 6.6 9.7 7.3 14.5 7.3 4.2 7.4 3.6 4.4
8.5 8.9 7.5 4.6 5.1 6.5 9.7 9.6 4.1 7.2 7.6 7.8 9.6 6.0 17.7 14.7 8.4 4.6 4.5 12.9 21.6 7.8 8.0 9.8 11.2 13.4 7.7 6.7 12.6 11.0 15.3 15.4 6.5 9.7 7.4 13.7 8.2 3.8 7.4 3.3 3.9
8.5 8.1 7.3 4.4 5.2 7.3 10.4 10.6 4.4 7.6 8.0 7.8 10.3 5.5 24.3 14.8 10.7 5.3 5.3 15.9 25.1 8.0 7.9 9.4 12.3 14.9 11.1 6.8 11.5 10.9 15.1 13.2 6.5 10.5 7.1 13.9 8.9 3.8 6.7 3.2 4.1
8.6 7.5 7.1 3.9 5.4 6.6 11.0 11.1 5.0 8.3 8.1 8.5 10.9 5.3 27.3 13.7 12.1 4.9 6.7 17.0 26.5 7.9 7.5 10.8 12.6 16.8 19.1 7.3 11.0 10.5 14.5 12.6 6.5 12.0 7.0 14.2 9.1 4.0 5.0 3.6 4.2
8.4 7.1 7.0 3.7 5.8 6.8 11.0 11.1 4.9 8.3 8.0 8.6 11.1 5.2 28.4 13.3 12.3 4.7 7.5 17.3 26.4 7.8 7.3 10.4 12.0 16.0 21.2 7.1 10.5 10.2 14.0 11.7 6.5 11.6 6.8 13.9 9.0 4.2 4.6 3.5 4.6
8.1 6.5 6.8 4.0 6.1 6.4 10.6 10.8 4.8 7.9 7.7 8.3 10.9 5.0 28.7 12.9 12.0 4.5 7.0 17.2 25.3 7.5 7.2 10.0 11.4 15.5 21.7 7.0 10.3 9.9 12.5 11.0 6.5 11.0 6.5 13.8 8.6 4.3 4.5 3.5 4.8
6.3 9.2
5.9 8.5
5.5 7.6
5.9 7.6
8.1 9.5
8.2 10.1
7.7 10.1
7.4 11.3
7.2 12.0
7.0 12.1
6.7 11.8
Source: UN/DESA, based on data of the OECD and Eurostat. a Unemployment data are standardized by the OECD and Eurostat for comparability among countries and over time, in conformity with the definitions of the International Labour Organization (see OECD, Standardized Unemployment Rates: Sources and Methods (Paris, 1985)). b Data for country groups are weighted averages, where labour force is used for weights. c Partly estimated. d Baseline scenario forecasts, based in part on Project LINK and the UN/DESA World Economic Forecasting Model. e Not standardized.