160
World Economic Situation and Prospects 2014
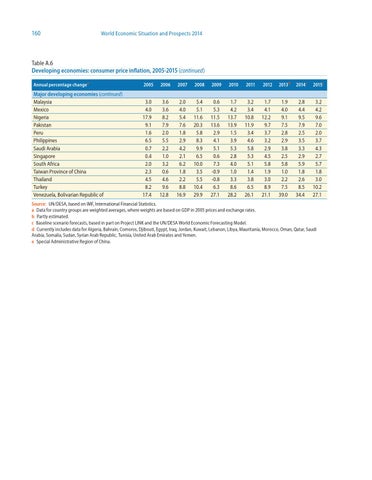
Table A.6 Developing economies: consumer price inflation, 2005-2015 (continued) Annual percentage changea
2005
2006
2007
2008
2009
2010
2011
2012
2013b
2014c
2015c
Major developing economies (continued) Malaysia Mexico Nigeria Pakistan Peru Philippines Saudi Arabia Singapore South Africa Taiwan Province of China Thailand Turkey Venezuela, Bolivarian Republic of
3.0 4.0 17.9 9.1 1.6 6.5 0.7 0.4 2.0 2.3 4.5 8.2 17.4
3.6 3.6 8.2 7.9 2.0 5.5 2.2 1.0 3.2 0.6 4.6 9.6 12.8
2.0 4.0 5.4 7.6 1.8 2.9 4.2 2.1 6.2 1.8 2.2 8.8 16.9
5.4 5.1 11.6 20.3 5.8 8.3 9.9 6.5 10.0 3.5 5.5 10.4 29.9
0.6 5.3 11.5 13.6 2.9 4.1 5.1 0.6 7.3 -0.9 -0.8 6.3 27.1
1.7 4.2 13.7 13.9 1.5 3.9 5.3 2.8 4.0 1.0 3.3 8.6 28.2
3.2 3.4 10.8 11.9 3.4 4.6 5.8 5.3 5.1 1.4 3.8 6.5 26.1
1.7 4.1 12.2 9.7 3.7 3.2 2.9 4.5 5.8 1.9 3.0 8.9 21.1
1.9 4.0 9.1 7.5 2.8 2.9 3.8 2.5 5.8 1.0 2.2 7.5 39.0
2.8 4.4 9.5 7.9 2.5 3.5 3.3 2.9 5.9 1.8 2.6 8.5 34.4
3.2 4.2 9.6 7.0 2.0 3.7 4.3 2.7 5.7 1.8 3.0 10.2 27.1
Source: UN/DESA, based on IMF, International Financial Statistics. a Data for country groups are weighted averages, where weights are based on GDP in 2005 prices and exchange rates. b Partly estimated. c Baseline scenario forecasts, based in part on Project LINK and the UN/DESA World Economic Forecasting Model. d Currently includes data for Algeria, Bahrain, Comoros, Djibouti, Egypt, Iraq, Jordan, Kuwait, Lebanon, Libya, Mauritania, Morocco, Oman, Qatar, Saudi Arabia, Somalia, Sudan, Syrian Arab Republic, Tunisia, United Arab Emirates and Yemen. e Special Administrative Region of China.