157
Annex tables
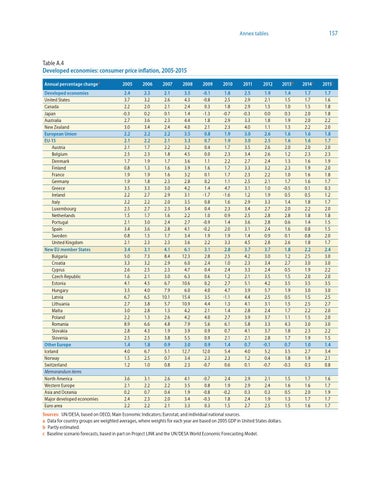
Table A.4 Developed economies: consumer price inflation, 2005-2015 Annual percentage changea
2005
2006
2007
2008
2009
2010
2011
2012
2013b
2014c
2015c
Developed economies United States Canada Japan Australia New Zealand European Union EU-15 Austria Belgium Denmark Finland France Germany Greece Ireland Italy Luxembourg Netherlands Portugal Spain Sweden United Kingdom New EU member States Bulgaria Croatia Cyprus Czech Republic Estonia Hungary Latvia Lithuania Malta Poland Romania Slovakia Slovenia Other Europe Iceland Norway Switzerland Memorandum items North America Western Europe Asia and Oceania Major developed economies Euro area
2.4 3.7 2.2 -0.3 2.7 3.0 2.2 2.1 2.1 2.5 1.7 0.8 1.9 1.9 3.5 2.2 2.2 2.5 1.5 2.1 3.4 0.8 2.1 3.4 5.0 3.3 2.6 1.6 4.1 3.5 6.7 2.7 3.0 2.2 8.9 2.8 2.5 1.4 4.0 1.5 1.2
2.3 3.2 2.0 0.2 3.6 3.4 2.2 2.2 1.7 2.3 1.9 1.3 1.9 1.8 3.3 2.7 2.2 2.7 1.7 3.0 3.6 1.5 2.3 3.1 7.3 3.2 2.5 2.1 4.5 4.0 6.5 3.8 2.8 1.3 6.6 4.3 2.5 1.8 6.7 2.5 1.0
2.1 2.6 2.1 0.1 2.3 2.4 2.2 2.1 2.2 1.8 1.7 1.6 1.6 2.3 3.0 2.9 2.0 2.3 1.6 2.4 2.8 1.7 2.3 4.1 8.4 2.9 2.3 3.0 6.7 7.9 10.1 5.7 1.3 2.6 4.8 1.9 3.8 0.9 5.1 0.7 0.8
3.5 4.3 2.4 1.4 4.4 4.0 3.5 3.3 3.2 4.5 3.6 3.9 3.2 2.8 4.2 3.1 3.5 3.4 2.2 2.7 4.1 3.4 3.6 6.1 12.3 6.0 4.7 6.3 10.6 6.0 15.4 10.9 4.2 4.2 7.9 3.9 5.5 3.0 12.7 3.4 2.3
-0.1 -0.8 0.3 -1.3 1.8 2.1 0.8 0.7 0.4 0.0 1.1 1.6 0.1 0.2 1.4 -1.7 0.8 0.4 1.0 -0.9 -0.2 1.9 2.2 3.1 2.8 2.4 0.4 0.6 0.2 4.0 3.5 4.4 2.1 4.0 5.6 0.9 0.9 0.9 12.0 2.3 -0.7
1.8 2.5 1.8 -0.7 2.9 2.3 1.9 1.9 1.7 2.3 2.2 1.7 1.7 1.1 4.7 -1.6 1.6 2.3 0.9 1.4 2.0 1.9 3.3 2.8 2.5 1.0 2.4 1.2 2.7 4.7 -1.1 1.3 1.4 2.7 6.1 0.7 2.1 1.4 5.4 2.3 0.6
2.5 2.9 2.9 -0.3 3.3 4.0 3.0 3.0 3.5 3.4 2.7 3.3 2.3 2.5 3.1 1.2 2.9 3.4 2.5 3.6 3.1 1.4 4.5 3.7 4.2 2.3 3.3 2.1 5.1 3.9 4.4 4.1 2.8 3.9 5.8 4.1 2.1 0.7 4.0 1.2 0.1
1.9 2.1 1.5 0.0 1.8 1.1 2.6 2.5 2.6 2.6 2.4 3.2 2.2 2.1 1.0 1.9 3.3 2.7 2.8 2.8 2.4 0.9 2.8 3.7 3.0 3.4 2.4 3.5 4.2 5.7 2.5 3.1 2.4 3.7 3.3 3.7 2.8 -0.1 5.2 0.4 -0.7
1.4 1.5 1.0 0.3 1.9 1.3 1.6 1.6 2.0 1.2 1.3 2.3 1.0 1.7 -0.5 0.5 1.4 2.0 2.8 0.6 1.6 0.1 2.6 1.8 1.2 2.7 0.5 1.5 3.5 1.9 0.5 1.5 1.7 1.1 4.3 1.8 1.7 0.7 3.5 1.8 -0.3
1.7 1.7 1.5 2.0 2.0 2.2 1.6 1.6 2.0 2.3 1.6 1.9 1.6 1.6 0.1 0.5 1.8 2.2 1.8 1.4 0.8 0.8 1.8 2.2 2.5 3.0 1.9 2.0 3.5 3.0 1.5 2.5 2.2 1.5 3.0 2.3 1.9 1.0 2.7 1.9 0.3
1.7 1.6 1.8 1.8 2.2 2.0 1.8 1.7 2.0 2.3 1.9 2.0 1.8 1.7 0.3 1.2 1.7 2.0 1.8 1.5 1.5 2.0 1.7 2.4 3.0 3.0 2.2 2.0 3.5 3.0 2.5 2.7 2.0 2.0 3.0 2.2 1.5 1.4 3.4 2.1 0.8
3.6 2.1 0.2 2.4 2.2
3.1 2.2 0.7 2.3 2.2
2.6 2.2 0.4 2.0 2.1
4.1 3.5 1.9 3.4 3.3
-0.7 0.8 -0.8 -0.3 0.3
2.4 1.9 -0.2 1.8 1.5
2.9 2.9 0.3 2.4 2.7
2.1 2.4 0.3 1.9 2.5
1.5 1.6 0.5 1.3 1.5
1.7 1.6 2.0 1.7 1.6
1.6 1.7 1.9 1.7 1.7
Sources: UN/DESA, based on OECD, Main Economic Indicators; Eurostat; and individual national sources. a Data for country groups are weighted averages, where weights for each year are based on 2005 GDP in United States dollars. b Partly estimated. c Baseline scenario forecasts, based in part on Project LINK and the UN/DESA World Economic Forecasting Model.