153
Annex tables
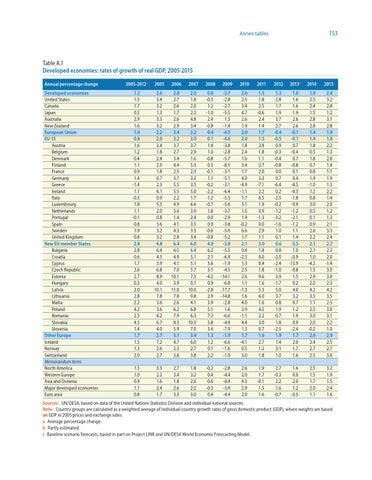
Table A.1 Developed economies: rates of growth of real GDP, 2005-2015 Annual percentage change
2005-2012a
2005
2006
2007
2008
Developed economies United States Canada Japan Australia New Zealand European Union EU-15 Austria Belgium Denmark Finland France Germany Greece Ireland Italy Luxembourg Netherlands Portugal Spain Sweden United Kingdom New EU member States Bulgaria Croatia Cyprus Czech Republic Estonia Hungary Latvia Lithuania Malta Poland Romania Slovakia Slovenia Other Europe Iceland Norway Switzerland Memorandum items North America Western Europe Asia and Oceania Major developed economies Euro area
1.2 1.5 1.7 0.5 2.9 1.6 1.0 0.8 1.6 1.2 0.4 1.1 0.9 1.4 -1.4 1.1 -0.3 1.8 1.1 -0.1 0.8 1.9 0.8 2.8 2.8 0.6 1.7 2.6 2.7 0.3 2.0 2.8 2.2 4.2 2.5 4.3 1.4 1.7 1.5 1.3 2.0
2.6 3.4 3.2 1.3 3.3 3.2 2.2 2.0 2.4 1.8 2.4 2.9 1.8 0.7 2.3 6.1 0.9 5.3 2.0 0.8 3.6 3.2 3.2 4.8 6.4 4.3 3.9 6.8 8.9 4.0 10.1 7.8 3.6 3.6 4.2 6.7 4.0 2.7 7.2 2.6 2.7
2.8 2.7 2.6 1.7 2.6 2.9 3.4 3.2 3.7 2.7 3.4 4.4 2.5 3.7 5.5 5.5 2.2 4.9 3.4 1.4 4.1 4.3 2.8 6.4 6.5 4.9 4.1 7.0 10.1 3.9 11.0 7.8 2.6 6.2 7.9 8.3 5.9 3.1 4.7 2.3 3.8
2.5 1.8 2.0 2.2 4.8 3.4 3.2 3.0 3.7 2.9 1.6 5.3 2.3 3.3 3.5 5.0 1.7 6.6 3.9 2.4 3.5 3.3 3.4 6.0 6.4 5.1 5.1 5.7 7.5 0.1 10.0 9.8 4.1 6.8 6.3 10.5 7.0 3.4 6.0 2.7 3.8
0.0 -0.3 1.2 -1.0 2.4 -0.8 0.4 0.1 1.4 1.0 -0.8 0.3 -0.1 1.1 -0.2 -2.2 -1.2 -0.7 1.8 0.0 0.9 -0.6 -0.8 4.0 6.2 2.1 3.6 3.1 -4.2 0.9 -2.8 2.9 3.9 5.1 7.3 5.8 3.4 1.3 1.2 0.1 2.2
1.5 1.0 0.9 1.1 0.8
3.3 2.2 1.6 2.4 1.7
2.7 3.4 1.8 2.6 3.3
1.8 3.2 2.6 2.2 3.0
-0.2 0.4 -0.6 -0.3 0.4
2010
2011
2012
2013b
2014c
2015c
-3.7 -2.8 -2.7 -5.5 1.5 -1.4 -4.5 -4.6 -3.8 -2.8 -5.7 -8.5 -3.1 -5.1 -3.1 -6.4 -5.5 -5.6 -3.7 -2.9 -3.8 -5.0 -5.2 -3.8 -5.5 -6.9 -1.9 -4.5 -14.1 -6.8 -17.7 -14.8 -2.8 1.6 -6.6 -4.9 -7.9 -1.9 -6.6 -1.6 -1.9
2.6 2.5 3.4 4.7 2.6 1.9 2.0 2.0 1.8 2.4 1.6 3.4 1.7 4.0 -4.9 -1.1 1.7 3.1 1.5 1.9 -0.2 6.6 1.7 2.1 0.4 -2.3 1.3 2.5 2.6 1.1 -1.3 1.6 4.0 3.9 -1.1 4.4 1.3 1.7 -4.1 0.5 3.0
1.5 1.8 2.5 -0.6 2.4 1.4 1.7 1.5 2.8 1.8 1.1 2.7 2.0 3.3 -7.1 2.2 0.5 1.9 0.9 -1.3 0.0 2.9 1.1 3.0 1.8 0.0 0.4 1.8 9.6 1.6 5.3 6.0 1.6 4.5 2.2 3.0 0.7 1.6 2.7 1.2 1.8
1.3 2.8 1.7 1.9 3.7 2.7 -0.4 -0.5 0.9 -0.3 -0.4 -0.8 0.0 0.7 -6.4 0.2 -2.5 -0.2 -1.2 -3.2 -1.6 1.0 0.1 0.6 0.8 -2.0 -2.4 -1.0 3.9 -1.7 5.0 3.7 0.8 1.9 0.7 1.8 -2.5 1.9 1.4 3.1 1.0
1.0 1.6 1.6 1.9 2.6 2.6 -0.1 -0.1 0.7 -0.4 0.7 -0.8 0.1 0.4 -4.5 -0.3 -1.8 0.9 -1.2 -2.1 -1.2 1.1 1.4 0.5 1.0 -0.9 -13.9 -0.8 1.5 0.2 4.0 3.2 0.7 1.2 1.9 0.9 -2.4 1.7 2.0 1.7 1.6
1.9 2.5 2.4 1.5 2.8 2.8 1.4 1.4 1.8 0.5 1.8 0.7 0.8 1.9 -1.0 1.2 0.8 3.0 0.5 0.1 0.9 2.6 2.2 2.1 2.1 1.0 -4.2 1.5 2.9 2.0 4.2 3.5 1.1 2.5 3.0 2.0 -0.2 2.6 2.4 2.7 2.5
2.4 3.2 2.8 1.2 3.1 2.8 1.9 1.8 2.2 1.3 2.8 1.4 1.1 1.9 1.3 2.2 1.4 2.0 1.2 1.3 2.1 3.3 2.4 2.7 2.3 2.0 -1.4 3.0 3.0 2.3 4.2 3.5 2.5 3.0 3.1 2.2 1.0 2.9 2.5 2.7 3.0
-2.8 -4.4 -4.4 -3.9 -4.4
2.6 2.0 4.3 2.9 2.0
1.9 1.7 -0.1 1.5 1.6
2.7 -0.3 2.2 1.6 -0.7
1.6 0.0 2.0 1.2 -0.5
2.5 1.5 1.7 2.0 1.1
3.2 1.9 1.5 2.4 1.6
2009
Sources: UN/DESA, based on data of the United Nations Statistics Division and individual national sources. Note: Country groups are calculated as a weighted average of individual country growth rates of gross domestic product (GDP), where weights are based on GDP in 2005 prices and exchange rates. a Average percentage change. b Partly estimated. c Baseline scenario forecasts, based in part on Project LINK and UN/DESA World Economic Forecasting Model.