23
Chapter I. Global economic outlook
Volatility of capital inflows As in the Asian financial crisis, the latest financial turmoil experienced by emerging economies has also been driven by procyclical movements in fickle international capital flows. In the run-up to the Asian financial crisis, net private capital inflows to emerging economies increased by about 90 per cent from 1994 to 1996, followed by a sharp decline of 50 per cent. Currently, net private capital inflows to emerging economies increased by 85 per cent from the trough of 2008 to 2012, followed by an estimated decline of 12 per cent in 2013.
Procyclical and fickle movements pervade international capital flows
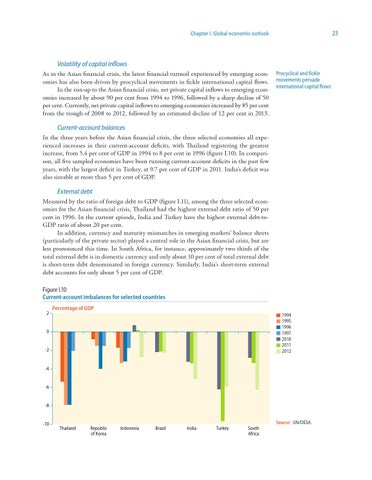
Current-account balances In the three years before the Asian financial crisis, the three selected economies all experienced increases in their current-account deficits, with Thailand registering the greatest increase, from 5.4 per cent of GDP in 1994 to 8 per cent in 1996 (figure I.10). In comparison, all five sampled economies have been running current-account deficits in the past few years, with the largest deficit in Turkey, at 9.7 per cent of GDP in 2011. India’s deficit was also sizeable at more than 5 per cent of GDP.
External debt Measured by the ratio of foreign debt to GDP (figure I.11), among the three selected economies for the Asian financial crisis, Thailand had the highest external debt ratio of 50 per cent in 1996. In the current episode, India and Turkey have the highest external debt-toGDP ratio of about 20 per cent. In addition, currency and maturity mismatches in emerging markets’ balance sheets (particularly of the private sector) played a central role in the Asian financial crisis, but are less pronounced this time. In South Africa, for instance, approximately two thirds of the total external debt is in domestic currency and only about 10 per cent of total external debt is short-term debt denominated in foreign currency. Similarly, India’s short-term external debt accounts for only about 5 per cent of GDP. Figure I.10 Current-account imbalances for selected countries 2
Percentage of GDP 1994 1995 1996 1997 2010 2011 2012
0
-2
-4
-6
-8
-10
Source: UN/DESA. Thailand
Republic of Korea
Indonesia
Brazil
India
Turkey
South Africa