22
World Economic Situation and Prospects 2014
Box I.4 Growth slowdown in the BRICS (continued)
a See The Conference Board Total Economy Database™, January 2013, available from http://www. conference-board.org/data/ economydatabase/. b These analyses include work by the World Bank, including the Global Economic Prospects: Less volatile but slower growth (June, 2013), the IMF, as well as national authorities. c Despite a significant negative output, inflationary pressures in India have remained elevated, largely owing to structural bottlenecks. This recently led India’s central bank to raise interest rates even as current output growth is considered to be below potential. Source: UN/DESA.
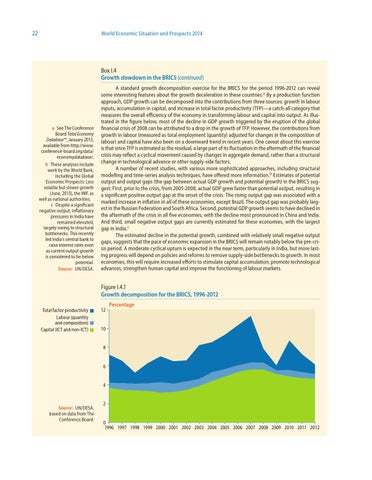
A standard growth decomposition exercise for the BRICS for the period 1996-2012 can reveal some interesting features about the growth deceleration in these countries.a By a production function approach, GDP growth can be decomposed into the contributions from three sources: growth in labour inputs, accumulation in capital, and increase in total factor productivity (TFP)—a catch-all category that measures the overall efficiency of the economy in transforming labour and capital into output. As illustrated in the figure below, most of the decline in GDP growth triggered by the eruption of the global financial crisis of 2008 can be attributed to a drop in the growth of TFP. However, the contributions from growth in labour (measured as total employment (quantity) adjusted for changes in the composition of labour) and capital have also been on a downward trend in recent years. One caveat about this exercise is that since TFP is estimated as the residual, a large part of its fluctuation in the aftermath of the financial crisis may reflect a cyclical movement caused by changes in aggregate demand, rather than a structural change in technological advance or other supply-side factors. A number of recent studies, with various more sophisticated approaches, including structural modelling and time-series analysis techniques, have offered more information.b Estimates of potential output and output gaps (the gap between actual GDP growth and potential growth) in the BRICS suggest: First, prior to the crisis, from 2005-2008, actual GDP grew faster than potential output, resulting in a significant positive output gap at the onset of the crisis. The rising output gap was associated with a marked increase in inflation in all of these economies, except Brazil. The output gap was probably largest in the Russian Federation and South Africa. Second, potential GDP growth seems to have declined in the aftermath of the crisis in all five economies, with the decline most pronounced in China and India. And third, small negative output gaps are currently estimated for these economies, with the largest gap in India.c The estimated decline in the potential growth, combined with relatively small negative output gaps, suggests that the pace of economic expansion in the BRICS will remain notably below the pre-crisis period. A moderate cyclical upturn is expected in the near term, particularly in India, but more lasting progress will depend on policies and reforms to remove supply-side bottlenecks to growth. In most economies, this will require increased efforts to stimulate capital accumulation, promote technological advances, strengthen human capital and improve the functioning of labour markets.
Figure I.4.1 Growth decomposition for the BRICS, 1996-2012 Total factor productivity Labour (quantity and composition) Capital (ICT and non-ICT)
12
Percentage
10
8
6
4
Source: UN/DESA, based on data from The Conference Board.
2
0 1996 1997 1998 1999 2000 2001 2002 2003 2004 2005 2006 2007 2008 2009 2010 2011 2012