2
World Economic Situation and Prospects 2014
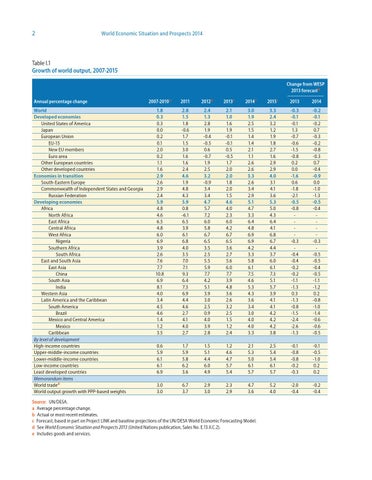
Table I.1 Growth of world output, 2007-2015 Change from WESP 2013 forecastd Annual percentage change
World Developed economies United States of America Japan European Union EU-15 New EU members Euro area Other European countries Other developed countries Economies in transition South-Eastern Europe Commonwealth of Independent States and Georgia Russian Federation Developing economies Africa North Africa East Africa Central Africa West Africa Nigeria Southern Africa South Africa East and South Asia East Asia China South Asia India Western Asia Latin America and the Caribbean South America Brazil Mexico and Central America Mexico Caribbean By level of development High-income countries Upper-middle-income countries Lower-middle-income countries Low-income countries Least developed countries Memorandum items World tradee World output growth with PPP-based weights
2007-2010a
2011
2012b
2013c
2014c
2015c
2013
2014
1.8 0.3 0.3 0.0 0.2 0.1 2.0 0.2 1.1 1.6 2.9 2.6 2.9 2.4 5.9 4.8 4.6 6.5 4.8 6.0 6.9 3.9 2.6 7.6 7.7 10.8 6.9 8.1 4.0 3.4 4.5 4.6 1.4 1.2 3.5
2.8 1.5 1.8 -0.6 1.7 1.5 3.0 1.6 1.6 2.4 4.6 1.9 4.8 4.3 5.9 0.8 -6.1 6.5 3.9 6.1 6.8 4.0 3.5 7.0 7.1 9.3 6.4 7.3 6.9 4.4 4.6 2.7 4.1 4.0 2.7
2.4 1.3 2.8 1.9 -0.4 -0.5 0.6 -0.7 1.9 2.5 3.2 -0.9 3.4 3.4 4.7 5.7 7.2 6.0 5.8 6.7 6.5 3.5 2.5 5.5 5.9 7.7 4.2 5.1 3.9 3.0 2.5 0.9 4.0 3.9 2.8
2.1 1.0 1.6 1.9 -0.1 -0.1 0.5 -0.5 1.7 2.0 2.0 1.8 2.0 1.5 4.6 4.0 2.3 6.0 4.2 6.7 6.5 3.6 2.7 5.6 6.0 7.7 3.9 4.8 3.6 2.6 3.2 2.5 1.5 1.2 2.4
3.0 1.9 2.5 1.5 1.4 1.4 2.1 1.1 2.6 2.6 3.3 2.6 3.4 2.9 5.1 4.7 3.3 6.4 4.8 6.9 6.9 4.2 3.3 5.8 6.1 7.5 4.6 5.3 4.3 3.6 3.4 3.0 4.0 4.0 3.3
3.3 2.4 3.2 1.2 1.9 1.8 2.7 1.6 2.9 2.9 4.0 3.1 4.1 3.6 5.3 5.0 4.3 6.4 4.1 6.8 6.7 4.4 3.7 6.0 6.1 7.3 5.1 5.7 3.9 4.1 4.1 4.2 4.2 4.2 3.8
0.6 5.9 6.1 6.1 6.9
1.7 5.9 5.8 6.2 3.6
1.5 5.1 4.4 6.0 4.9
1.2 4.6 4.7 5.7 5.4
2.1 5.3 5.0 6.1 5.7
2.5 5.4 5.4 6.1 5.7
3.0 3.0
6.7 3.7
2.9 3.0
2.3 2.9
4.7 3.6
5.2 4.0
-0.3 -0.1 -0.1 1.3 -0.7 -0.6 -1.5 -0.8 0.2 0.0 -1.6 0.6 -1.8 -2.1 -0.5 -0.8 -0.3 -0.4 -0.4 -0.2 -0.2 -1.1 -1.3 0.3 -1.3 -0.8 -1.5 -2.4 -2.6 -1.3 -0.1 -0.8 -0.8 -0.2 -0.3 -2.0 -0.4
-0.2 -0.1 -0.2 0.7 -0.3 -0.2 -0.8 -0.3 0.7 -0.4 -0.9 0.0 -1.0 -1.3 -0.5 -0.4 -0.3 -0.5 -0.5 -0.4 -0.5 -1.1 -1.2 0.2 -0.8 -1.0 -1.4 -0.6 -0.6 -0.5 -0.1 -0.5 -1.0 0.2 0.2 -0.2 -0.4
Source: UN/DESA. a Average percentage change. b Actual or most recent estimates. c Forecast, based in part on Project LINK and baseline projections of the UN/DESA World Economic Forecasting Model. d See World Economic Situation and Prospects 2013 (United Nations publication, Sales No. E.13.II.C.2). e Includes goods and services.