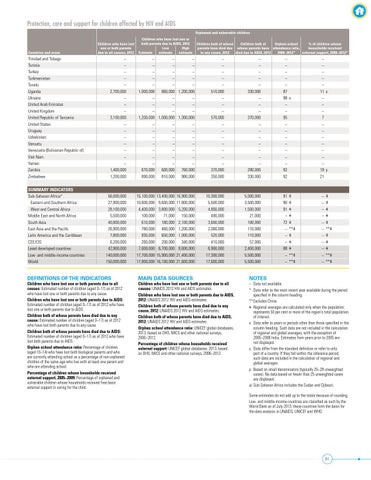
Protection, care and support for children affected by HIV and AIDS Orphaned and vulnerable children
Countries and areas
Children who have lost one or both parents due to all causes, 2012
Trinidad and Tobago Tunisia Turkey Turkmenistan Tuvalu Uganda Ukraine United Arab Emirates United Kingdom United Republic of Tanzania United States Uruguay Uzbekistan Vanuatu Venezuela (Bolivarian Republic of) Viet Nam Yemen Zambia Zimbabwe
– – – – – 2,700,000 – – – 3,100,000 – – – – – – – 1,400,000 1,200,000
SUMMARY INDICATORS Sub-Saharan Africaa/ Eastern and Southern Africa West and Central Africa Middle East and North Africa South Asia East Asia and the Pacific Latin America and the Caribbean CEE/CIS Least developed countries Low- and middle-income countries World
56,000,000 27,900,000 28,100,000 5,500,000 40,800,000 26,900,000 7,800,000 6,200,000 42,900,000 140,000,000 150,000,000
DEFINITIONS OF THE INDICATORS
Children who have lost one or both parents due to all causes: Estimated number of children (aged 0–17) as of 2012 who have lost one or both parents due to any cause. Children who have lost one or both parents due to AIDS: Estimated number of children (aged 0–17) as of 2012 who have lost one or both parents due to AIDS. Children both of whose parents have died due to any cause: Estimated number of children (aged 0–17) as of 2012 who have lost both parents due to any cause. Children both of whose parents have died due to AIDS: Estimated number of children (aged 0–17) as of 2012 who have lost both parents due to AIDS. Orphan school attendance ratio: Percentage of children (aged 10–14) who have lost both biological parents and who are currently attending school as a percentage of non-orphaned children of the same age who live with at least one parent and who are attending school. Percentage of children whose households received external support, 2005–2009: Percentage of orphaned and vulnerable children whose households received free basic external support in caring for the child.
Children who have lost one or both parents due to AIDS, 2012 Low High Estimate estimate estimate
– – – – – – – – – – – – – – – 1,000,000 860,000 1,200,000 – – – – – – – – – 1,200,000 1,000,000 1,300,000 – – – – – – – – – – – – – – – – – – – – – 670,000 600,000 760,000 890,000 810,000 980,000
15,100,000 10,600,000 4,400,000 100,000 610,000 780,000 830,000 260,000 7,600,000 17,700,000 17,800,000
13,400,000 9,600,000 3,800,000 71,000 180,000 460,000 650,000 200,000 6,700,000 15,900,000 16,100,000
16,900,000 11,800,000 5,200,000 150,000 2,100,000 1,200,000 1,000,000 340,000 8,600,000 21,400,000 21,600,000
MAIN DATA SOURCES
Children both of whose Children both of Orphan school % of children whose parents have died due whose parents have attendance ratio, households received to any cause, 2012 died due to AIDS, 2012 2008–2012* external support, 2008–2012*
– – – – – 510,000 – – – 570,000 – – – – – – – 370,000 350,000
– – – – – 330,000 – – – 370,000 – – – – – – – 280,000 330,000
10,300,000 5,500,000 4,800,000 490,000 3,600,000 2,000,000 520,000 410,000 6,900,000 17,300,000 17,600,000
5,000,000 3,500,000 1,500,000 21,000 180,000 110,000 110,000 57,000 2,400,000 5,500,000 5,500,000
Children who have lost one or both parents due to all causes: UNAIDS 2012 HIV and AIDS estimates. Children who have lost one or both parents due to AIDS, 2012: UNAIDS 2012 HIV and AIDS estimates. Children both of whose parents have died due to any cause, 2012: UNAIDS 2012 HIV and AIDS estimates. Children both of whose parents have died due to AIDS, 2012: UNAIDS 2012 HIV and AIDS estimates. Orphan school attendance ratio: UNICEF global databases, 2013, based on DHS, MICS and other national surveys, 2006–2012. Percentage of children whose households received external support: UNICEF global databases, 2013, based on DHS, MICS and other national surveys, 2006–2012.
– – – – – 87 98 x – – 95 – – – – – – – 92 92
91 90 91 – 72 – – – 88 – –
ǂ ǂ ǂ ǂ ǂ **ǂ ǂ ǂ ǂ **ǂ **ǂ
– – – – – 11 x – – – 7 – – – – – – – 19 y 21
– – – – – – – – – – –
ǂ ǂ ǂ ǂ ǂ **ǂ ǂ ǂ ǂ **ǂ **ǂ
NOTES
– Data not available. * Data refer to the most recent year available during the period specified in the column heading. ** Excludes China. ǂ Regional averages are calculated only when the population represents 50 per cent or more of the region’s total population of interest. x Data refer to years or periods other than those specified in the column heading. Such data are not included in the calculation of regional and global averages, with the exception of 2005–2006 India. Estimates from years prior to 2005 are not displayed. y Data differ from the standard definition or refer to only part of a country. If they fall within the reference period, such data are included in the calculation of regional and global averages. p Based on small denominators (typically 25–29 unweighted cases). No data based on fewer than 25 unweighted cases are displayed. a/ Sub-Saharan Africa includes the Sudan and Djibouti. Some estimates do not add up to the totals because of rounding. Low- and middle-income countries are classified as such by the World Bank as of July 2013; these countries form the basis for the data analysis in UNAIDS, UNICEF and WHO.
81