TABLE 6 Protection, care and support for children affected by HIV and AIDS Orphaned and vulnerable children
TOWARDS AN AIDS-FREE GENERATION – Children and AIDS: Sixth Stocktaking Report, 2013
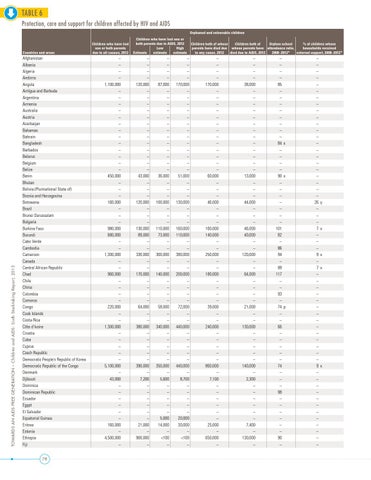
Countries and areas
Afghanistan Albania Algeria Andorra Angola Antigua and Barbuda Argentina Armenia Australia Austria Azerbaijan Bahamas Bahrain Bangladesh Barbados Belarus Belgium Belize Benin Bhutan Bolivia (Plurinational State of) Bosnia and Herzegovina Botswana Brazil Brunei Darussalam Bulgaria Burkina Faso Burundi Cabo Verde Cambodia Cameroon Canada Central African Republic Chad Chile China Colombia Comoros Congo Cook Islands Costa Rica Côte d’Ivoire Croatia Cuba Cyprus Czech Republic Democratic People’s Republic of Korea Democratic Republic of the Congo Denmark Djibouti Dominica Dominican Republic Ecuador Egypt El Salvador Equatorial Guinea Eritrea Estonia Ethiopia Fiji 78
Children who have lost one or both parents due to all causes, 2012
– – – – 1,100,000 – – – – – – – – – – – – – 450,000 – – – 160,000 – – – 980,000 680,000 – – 1,300,000 – – 960,000 – – – – 220,000 – – 1,300,000 – – – – – 5,100,000 – 43,000 – – – – – – 160,000 – 4,500,000 –
Children who have lost one or both parents due to AIDS, 2012 Low High Estimate estimate estimate
– – – – 120,000 – – – – – – – – – – – – – 43,000 – – – 120,000 – – – 130,000 89,000 – – 330,000 – – 170,000 – – – – 64,000 – – 380,000 – – – – – 390,000 – 7,200 – – – – – – 21,000 – 900,000 –
– – – – 87,000 – – – – – – – – – – – – – 36,000 – – – 100,000 – – – 110,000 73,000 – – 300,000 – – 140,000 – – – – 58,000 – – 340,000 – – – – – 350,000 – 5,600 – – – – – 5,000 14,000 – <100 –
– – – – 170,000 – – – – – – – – – – – – – 51,000 – – – 130,000 – – – 160,000 110,000 – – 380,000 – – 200,000 – – – – 72,000 – – 440,000 – – – – – 440,000 – 8,700 – – – – – 20,000 30,000 – <100 –
Children both of whose Children both of Orphan school % of children whose parents have died due whose parents have attendance ratio, households received to any cause, 2012 died due to AIDS, 2012 2008–2012* external support, 2008–2012*
– – – – 170,000 – – – – – – – – – – – – – 60,000 – – – 46,000 – – – 160,000 140,000 – – 250,000 – – 180,000 – – – – 39,000 – – 240,000 – – – – – 860,000 – 7,100 – – – – – – 25,000 – 650,000 –
– – – – 38,000 – – – – – – – – – – – – – 13,000 – – – 44,000 – – – 46,000 40,000 – – 120,000 – – 64,000 – – – – 21,000 – – 130,000 – – – – – 140,000 – 2,300 – – – – – – 7,400 – 130,000 –
– – – – 85 – – – – – – – – 84 x – – – – 90 x – – – – – – – 101 82 – 86 94 – 88 117 – – 93 – 74 p – – 66 – – – – – 74 – – – 98 – – – – – – 90 –
– – – – – – – – – – – – – – – – – – – – – – 26 – – – 7 – – – 9 – 7 – – – – – – – – – – – – – – 9 – – – – – – – – – – – –
y
x
x x
x