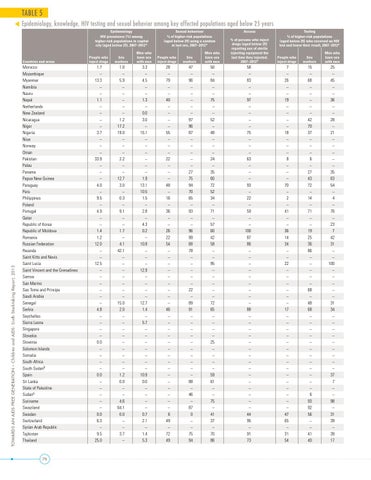
TABLE 5 Epidemiology, knowledge, HIV testing and sexual behavior among key affected populations aged below 25 years Epidemiology HIV prevalence (%) among higher-risk populations in capital city (aged below 25), 2007–2012*
TOWARDS AN AIDS-FREE GENERATION – Children and AIDS: Sixth Stocktaking Report, 2013
Countries and areas
Morocco Mozambique Myanmar Namibia Nauru Nepal Netherlands New Zealand Nicaragua Niger Nigeria Niue Norway Oman Pakistan Palau Panama Papua New Guinea Paraguay Peru Philippines Poland Portugal Qatar Republic of Korea Republic of Moldova Romania Russian Federation Rwanda Saint Kitts and Nevis Saint Lucia Saint Vincent and the Grenadines Samoa San Marino Sao Tome and Principe Saudi Arabia Senegal Serbia Seychelles Sierra Leone Singapore Slovakia Slovenia Solomon Islands Somalia South Africa South Sudanδ Spain Sri Lanka State of Palestine Sudanδ Suriname Swaziland Sweden Switzerland Syrian Arab Republic Tajikistan Thailand
76
Sexual behaviour % of higher-risk populations (aged below 25) using a condom at last sex, 2007–2012*
People who inject drugs
Sex workers
Men who have sex with men
People who inject drugs
Sex workers
Men who have sex with men
1.7 – 13.3 – – 1.1 – – – – 3.7 – – – 33.9 – – – 4.0 – 9.5 – 4.9 – – 1.4 1.2 12.0 – – 12.5 – – – – – – 4.8 – – – – 0.0 – – – – 0.0 – – – – – 0.0 6.3 – 9.5 25.0
1.0 – 5.9 – – – – – 1.2 17.2 19.0 – – – 2.2 – – 12.7 3.0 – 0.3 – 9.1 – – 1.7 – 4.1 42.1 – – – – – – – 15.0 2.0 – – – – – – – – – 1.2 0.0 – – 4.6 64.1 0.0 – – 3.7 –
3.3 – 4.5 – – 1.3 – 0.0 3.0 – 15.1 – – – – – – 1.9 13.1 10.5 1.5 – 2.8 – 4.3 0.2 – 10.8 – – – 12.9 – – – – 12.7 1.4 – 5.7 – – – – – – – 10.9 0.0 – – – – 0.7 2.1 – 1.4 5.3
28 – 79 – – 40 – – – – 55 – – – 22 – – – 48 – 16 – 36 – – 26 22 54 – – – – – – – – – 46 – – – – – – – – – – – – – – – 6 49 – 72 49
47 – 96 – – – – – 97 96 87 – – – – – 27 75 94 70 65 – 93 – – 96 99 68 78 – – – – – 22 – 89 91 – – – – – – – – – – 88 – 46 – 87 0 – – 75 94
50 – 84 – – 75 – – 52 – 48 – – – 24 – 35 60 72 52 34 – 71 – 57 60 42 58 – – 95 – – – – – 72 65 – – – – 25 – – – – 59 61 – – 75 – 41 37 – 70 86
Access % of persons who inject drugs (aged below 25) reporting use of sterile injecting equipment the last time they injected, 2007–2012*
58 – 83 – – 97 – – – – 75 – – – 63 – – – 93 – 22 – 59 – – 100 87 86 – – – – – – – – – 88 – – – – – – – – – – – – – – – 44 95 – 91 73
Testing % of higher-risk populations (aged below 25) who received an HIV test and knew their result, 2007–2012* People who inject drugs
Sex workers
Men who have sex with men
7 – 26 – – 19 – – – – 18 – – – 8 – – – 70 – 2 – 41 – – 36 14 34 – – 22 – – – – – – 17 – – – – – – – – – – – – – – – 47 65 – 31 54
15 – 68 – – – – – 42 70 37 – – – 6 – 27 43 72 – 14 – 71 – – 19 25 36 86 – – – – – 68 – 48 68 – – – – – – – – – – – – 6 93 92 56 – – 41 40
25 – 45 – – 36 – – 28 – 21 – – – – – 35 63 54 – 4 – 76 – 23 7 42 31 – – 100 – – – – – 31 34 – – – – – – – – – 37 7 – – 98 – 31 39 – 39 17