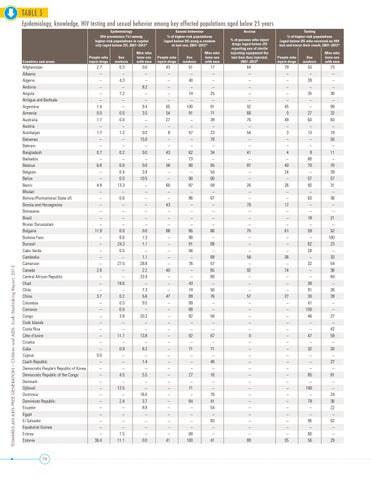
TABLE 5 Epidemiology, knowledge, HIV testing and sexual behavior among key affected populations aged below 25 years Epidemiology HIV prevalence (%) among higher-risk populations in capital city (aged below 25), 2007–2012*
TOWARDS AN AIDS-FREE GENERATION – Children and AIDS: Sixth Stocktaking Report, 2013
Countries and areas
Afghanistan Albania Algeria Andorra Angola Antigua and Barbuda Argentina Armenia Australia Austria Azerbaijan Bahamas Bahrain Bangladesh Barbados Belarus Belgium Belize Benin Bhutan Bolivia (Plurinational State of) Bosnia and Herzegovina Botswana Brazil Brunei Darussalam Bulgaria Burkina Faso Burundi Cabo Verde Cambodia Cameroon Canada Central African Republic Chad Chile China Colombia Comoros Congo Cook Islands Costa Rica Côte d’Ivoire Croatia Cuba Cyprus Czech Republic Democratic People’s Republic of Korea Democratic Republic of the Congo Denmark Djibouti Dominica Dominican Republic Ecuador Egypt El Salvador Equatorial Guinea Eritrea Estonia
74
Sexual behaviour % of higher-risk populations (aged below 25) using a condom at last sex, 2007–2012*
Access
People who inject drugs
Sex workers
Men who have sex with men
People who inject drugs
Sex workers
Men who have sex with men
% of persons who inject drugs (aged below 25) reporting use of sterile injecting equipment the last time they injected, 2007–2012*
2.7 – – – – – 1.4 0.0 1.7 – 1.7 – – 0.7 – 6.8 – – 4.8 – – – – – – 11.9 – – – – – 2.6 – – – 3.7 – – – – – – – – 0.0 – – – – – – – – – – – – 36.4
0.3 – 4.3 – 7.2 – – 0.0 0.0 – 1.2 – – 0.2 – 0.0 0.4 0.0 13.3 – 0.6 – – – – 0.0 8.6 24.3 0.5 – 27.5 – – 19.6 – 0.2 0.5 0.0 3.8 – – 11.7 – 0.9 – – – 4.5 – 12.5 – 2.4 – – – – 1.5 11.1
0.0 – – 8.2 – – 9.4 3.5 – – 0.0 15.0 – 0.0 – 0.0 3.8 10.5 – – – – – – – 0.0 1.3 1.1 – 1.1 28.8 2.2 33.9 – 7.3 5.6 9.5 – 20.2 – – 13.8 – 6.2 – 1.4 – 5.5 – – 16.0 3.7 8.8 – – – – 0.0
43 – – – – – 65 54 27 – 8 – – 43 – 58 – – 60 – – 43 – – – 68 – – – – – 40 – – – 47 – – – – – – – – – – – – – – – – – – – – – 41
51 – 40 – 74 – 100 91 – – 57 – – 62 73 80 – 90 87 – 96 – – – – 85 98 91 56 – 76 – – 43 74 89 99 68 82 – – 92 – 71 – – – 27 – 71 – 84 – – – – 68 100
17 – – – 25 – 91 71 39 – 23 79 – 34 – 65 54 60 59 – 67 – – – – 66 – 68 – 69 57 65 69 – 50 76 – – 59 – – 67 – 71 – 40 – 16 – – 70 41 54 – 83 – – 41
64 – – – – – 92 66 75 – 54 – – 41 – 87 – – 26 – – 76 – – – 75 – – – 58 – 92 – – – 57 – – – – – 0 – – – – – – – – – – – – – – – 89
Testing % of higher-risk populations (aged below 25) who received an HIV test and knew their result, 2007–2012* People who inject drugs
Sex workers
Men who have sex with men
79 – – – – – 45 0 49 – 3 – – 4 – 40 24 – 26 – – 17 – – – 61 – – – 36 – 74 – – – 27 – – – – – – – – – – – – – – – – – – – – – 35
53 – 39 – 35 – – 27 60 – 13 – – 8 80 70 – 57 92 – 63 – – 18 – 59 – 62 28 – 32 – – 38 91 30 41 100 46 – – 47 – 32 – – – 85 – 100 – 79 – – 95 – 80 56
73 – – – 30 – 99 32 83 – 19 50 – 11 – 70 39 57 31 – 36 – – 21 – 52 100 23 – 33 54 36 84 – 26 39 – – 27 – 42 59 – 20 – 27 – 81 – – 24 36 22 – 52 – – 29