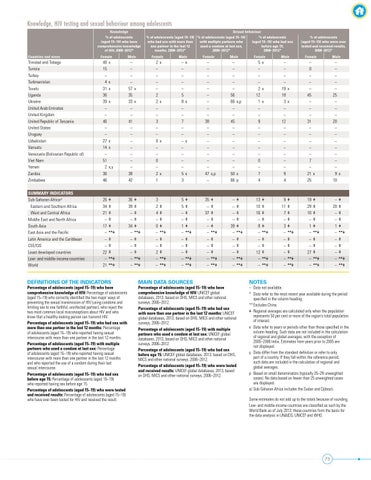
Knowledge, HIV testing and sexual behaviour among adolescents Knowledge % of adolescents (aged 15–19) who have comprehensive knowledge of HIV, 2008–2012* Countries and areas
Female
Trinidad and Tobago Tunisia Turkey Turkmenistan Tuvalu Uganda Ukraine United Arab Emirates United Kingdom United Republic of Tanzania United States Uruguay Uzbekistan Vanuatu Venezuela (Bolivarian Republic of) Viet Nam Yemen Zambia Zimbabwe
49 15 – 4 31 36 39 – – 46 – – 27 14 – 51 2 36 46
x
SUMMARY INDICATORS Sub-Saharan Africaa/ Eastern and Southern Africa West and Central Africa Middle East and North Africa South Asia East Asia and the Pacific Latin America and the Caribbean CEE/CIS Least developed countries Low- and middle-income countries World
26 34 21 – 17 – – – 22 – 21
ǂ ǂ ǂ ǂ ǂ **ǂ ǂ ǂ ǂ **ǂ **ǂ
x x x
x x
x,y
DEFINITIONS OF THE INDICATORS
Percentage of adolescents (aged 15–19) who have comprehensive knowledge of HIV: Percentage of adolescents (aged 15–19) who correctly identified the two major ways of preventing the sexual transmission of HIV (using condoms and limiting sex to one faithful, uninfected partner), who reject the two most common local misconceptions about HIV and who know that a healthy-looking person can transmit HIV. Percentage of adolescents (aged 15–19) who had sex with more than one partner in the last 12 months: Percentage of adolescents (aged 15–19) who reported having sexual intercourse with more than one partner in the last 12 months. Percentage of adolescents (aged 15–19) with multiple partners who used a condom at last sex: Percentage of adolescents (aged 15–19) who reported having sexual intercourse with more than one partner in the last 12 months and who reported the use of a condom during their last sexual intercourse. Percentage of adolescents (aged 15–19) who had sex before age 15: Percentage of adolescents (aged 15–19) who reported having sex before age 15. Percentage of adolescents (aged 15–19) who were tested and received results: Percentage of adolescents (aged 15–19) who have ever been tested for HIV and received the result.
Sexual behaviour % of adolescents (aged 15–19) % of adolescents (aged 15–19) % of adolescents who had sex with more than with multiple partners who (aged 15–19) who had sex one partner in the last 12 used a condom at last sex, before age 15, months, 2008–2012* 2008–2012* 2008–2012*
Male
Female
Male
– – – – 57 x 35 33 x – – 41 – – – – – – – 38 42
2 – – – – 2 2 – – 3 – – 0 – – 0 – 2 1
– – – – – 5 8 – – 7 – – – – – – – 5 3
x
5 5 – – 1 – – – – – –
ǂ ǂ ǂ ǂ ǂ **ǂ ǂ ǂ ǂ **ǂ **ǂ
36 39 – – 34 – – – – – –
ǂ ǂ ǂ ǂ ǂ **ǂ ǂ ǂ ǂ **ǂ **ǂ
3 2 4 – 0 – – – 2 – –
x
x
x
x
ǂ ǂ ǂ ǂ **ǂ ǂ ǂ ǂ **ǂ **ǂ
x
x
x
MAIN DATA SOURCES
Female
– – – – – – – – – 38 – – – – – – – 47 x,p –
35 – 37 – – – – – – – –
ǂ ǂ ǂ ǂ ǂ **ǂ ǂ ǂ ǂ **ǂ **ǂ
Male
– – – – – 56 66 x,p – – 45 – – – – – – – 50 x 66 p
– – – – 39 – – – – – –
ǂ ǂ ǂ ǂ ǂ **ǂ ǂ ǂ ǂ **ǂ **ǂ
Percentage of adolescents (aged 15–19) who have comprehensive knowledge of HIV: UNICEF global databases, 2013, based on DHS, MICS and other national surveys, 2006–2012. Percentage of adolescents (aged 15–19) who had sex with more than one partner in the last 12 months: UNICEF global databases, 2013, based on DHS, MICS and other national surveys, 2006–2012. Percentage of adolescents (aged 15–19) with multiple partners who used a condom at last sex: UNICEF global databases, 2013, based on DHS, MICS and other national surveys, 2006–2012. Percentage of adolescents (aged 15–19) who had sex before age 15: UNICEF global databases, 2013, based on DHS, MICS and other national surveys, 2006–2012. Percentage of adolescents (aged 15–19) who were tested and received results: UNICEF global databases, 2013, based on DHS, MICS and other national surveys, 2006–2012.
% of adolescents (aged 15–19) who were ever tested and received results, 2008–2012*
Female
Male
Female
Male
5x – – – 2x 12 1x – – 9 – – – – – 0 – 7 4
– – – – 19 x 18 3x – – 12 – – – – – – – 9 4
– 0 – – – 45 – – – 31 – – – – – 7 – 21 x 25
– – – – – 25 – – – 20 – – – – – – – 9x 10
13 10 16 – 8 – – – 12 – –
ǂ ǂ ǂ ǂ ǂ **ǂ ǂ ǂ ǂ **ǂ **ǂ
9 11 7 – 3 – – – – – –
ǂ ǂ ǂ ǂ ǂ **ǂ ǂ ǂ ǂ **ǂ **ǂ
19 29 10 – 1 – – – 27 – –
ǂ ǂ ǂ ǂ ǂ **ǂ ǂ ǂ ǂ **ǂ **ǂ
– 20 – – 1 – – – – – –
ǂ ǂ ǂ ǂ ǂ **ǂ ǂ ǂ ǂ **ǂ **ǂ
NOTES
– Data not available. * Data refer to the most recent year available during the period specified in the column heading. ** Excludes China. ǂ Regional averages are calculated only when the population represents 50 per cent or more of the region’s total population of interest. x Data refer to years or periods other than those specified in the column heading. Such data are not included in the calculation of regional and global averages, with the exception of 2005–2006 India. Estimates from years prior to 2005 are not displayed. y Data differ from the standard definition or refer to only part of a country. If they fall within the reference period, such data are included in the calculation of regional and global averages. p Based on small denominators (typically 25–29 unweighted cases). No data based on fewer than 25 unweighted cases are displayed. a/ Sub-Saharan Africa includes the Sudan and Djibouti. Some estimates do not add up to the totals because of rounding. Low- and middle-income countries are classified as such by the World Bank as of July 2013; these countries form the basis for the data analysis in UNAIDS, UNICEF and WHO.
73