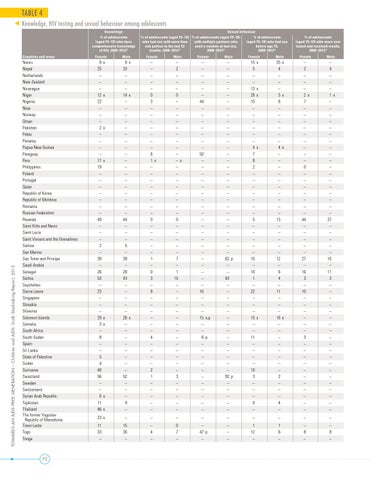
TABLE 4 Knowledge, HIV testing and sexual behaviour among adolescents Knowledge % of adolescents (aged 15–19) who have comprehensive knowledge of HIV, 2008–2012*
TOWARDS AN AIDS-FREE GENERATION – Children and AIDS: Sixth Stocktaking Report, 2013
Countries and areas
Nauru Nepal Netherlands New Zealand Nicaragua Niger Nigeria Niue Norway Oman Pakistan Palau Panama Papua New Guinea Paraguay Peru Philippines Poland Portugal Qatar Republic of Korea Republic of Moldova Romania Russian Federation Rwanda Saint Kitts and Nevis Saint Lucia Saint Vincent and the Grenadines Samoa San Marino Sao Tome and Principe Saudi Arabia Senegal Serbia Seychelles Sierra Leone Singapore Slovakia Slovenia Solomon Islands Somalia South Africa South Sudan Spain Sri Lanka State of Palestine Sudan Suriname Swaziland Sweden Switzerland Syrian Arab Republic Tajikistan Thailand The former Yugoslav Republic of Macedonia Timor-Leste Togo Tonga
72
Female
8 25 – – – 12 22 – – – 2 – – – – 17 19 – – – – – – – 49 – – – 2 – 39 – 26 53 – 23 – – – 29 3 – 8 – – 5 4 40 56 – – 6 11 46
x
x
x
x
x x
x x
23 x 11 33 –
Sexual behaviour % of adolescents (aged 15–19) % of adolescents (aged 15–19) % of adolescents who had sex with more than with multiple partners who (aged 15–19) who had sex one partner in the last 12 used a condom at last sex, before age 15, months, 2008–2012* 2008–2012* 2008–2012*
Male
Female
Male
8x 33 – – – 14 x – – – – – – – – – – – – – – – – – – 44 – – – 5 – 39 – 28 43 – – – – – 26 x – – – – – – – – 52 – – – 9 –
– – – – – 0 3 – – – – – – – 6 1x – – – – – – – – 0 – – – – – 1 – 0 3 – 8 – – – – – – 4 – – – – 2 1 – – – – –
– 2 – – – 0 – – – – – – – – – –x – – – – – – – – 0 – – – – – 7 – 1 15 – – – – – – – – – – – – – – 3 – – – – –
Female
– – – – – – 44 – – – – – – – 50 – – – – – – – – – – – – – – – – – – – – 10 – – – 15 x,p – – 6p – – – – – – – – – – –
Male
Female
– – – – – – – – – – – – – – – – – – – – – – – – – – – – – – 62 p – – 63 – – – – – – – – – – – – – – 92 p – – – – –
15 5 – – 13 26 15 – – – – – – 4 7 6 2 – – – – – – – 5 – – – – – 10 – 10 1 – 22 – – – 15 – – 11 – – – – 10 3 – – – 0 –
x
x x
x
x
Male
35 4 – – – 5 6 – – – – – – 4 – – – – – – – – – – 13 – – – – – 12 – 6 4 – 11 – – – 16 – – – – – – – – 2 – – – 4 –
x
x
x
x
% of adolescents (aged 15–19) who were ever tested and received results, 2008–2012* Female
Male
– 2 – – – 2x 7 – – – – – – – – – 0 – – – – – – – 44 – – – – – 27 – 16 3 – 10 – – – – – – 3 – – – – – – – – – – –
– 4 – – – 1x – – – – – – – – – – – – – – – – – – 37 – – – – – 10 – 11 3 – – – – – – – – – – – – – – – – – – – –
–
–
–
–
–
–
–
–
–
15 36 –
– 4 –
0 7 –
– 47 p –
– – –
1 12 –
1 6 –
– 8 –
– 8 –