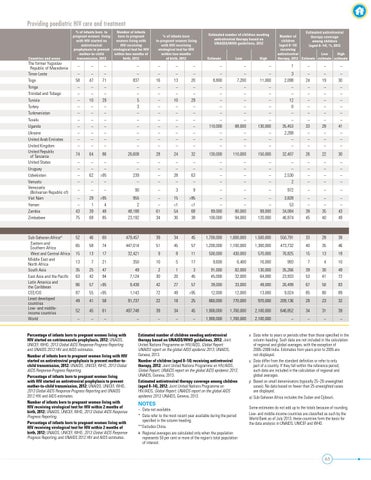
Providing paediatric HIV care and treatment
Countries and areas
The former Yugoslav Republic of Macedonia Timor-Leste Togo Tonga Trinidad and Tobago Tunisia Turkey Turkmenistan Tuvalu Uganda Ukraine United Arab Emirates United Kingdom United Republic of Tanzania United States Uruguay Uzbekistan Vanuatu Venezuela (Bolivarian Republic of) Viet Nam Yemen Zambia Zimbabwe
Sub-Saharan Africaa/ Eastern and Southern Africa West and Central Africa Middle East and North Africa South Asia East Asia and the Pacific Latin America and the Caribbean CEE/CIS Least developed countries Low- and middleincome countries World
% of infants born to Number of infants pregnant women living born to pregnant with HIV started on women living with antiretroviral HIV receiving prophylaxis to prevent virological test for HIV mother-to-child within two months of transmission, 2012 birth, 2012
% of infants born to pregnant women living with HIV receiving virological test for HIV within two months of birth, 2012
Estimated number of children needing antiretroviral therapy based on UNAIDS/WHO guidelines, 2012
Estimate
Low
High
Estimated antiretroviral Number of therapy coverage children among children (aged 0–14) (aged 0–14), %, 2012 receiving antiretroviral Low High therapy, 2012 Estimate estimate estimate
–
–
–
–
–
–
–
–
–
–
1
–
–
–
– 58 – – – – – – – – – –
– 47 – – 10 – – – – – – –
– 71 – – 29 – – – – – – –
– 837 – – 5 3 – – – – – –
– 16 – – – – – – – – – –
– 13 – – 10 – – – – – – –
– 20 – – 29 – – – – – – –
– 8,800 – – – – – – 110,000 – – –
– 7,200 – – – – – – 88,000 – – –
– 11,000 – – – – – – 130,000 – – –
3 2,098 – – 12 0 – – 35,453 2,268 – –
– 24 – – – – – – 33 – – –
– 19 – – – – – – 28 – – –
– 30 – – – – – – 41 – – –
74
64
86
26,608
28
24
32
130,000
110,000
150,000
32,407
26
22
30
– – – –
– – 62 –
– – >95 –
– – 239 –
– – – –
– – 28 –
– – 63 –
– – – –
– – – –
– – – –
– – 2,530 2
– – – –
– – – –
– – – –
–
–
–
90
–
3
9
–
–
–
972
–
–
–
– – 43 75
29 1 39 68
>95 4 48 85
955 2 48,188 23,192
– – 61 34
15 <1 54 30
>95 <1 68 38
– – 89,000 100,000
– – 80,000 94,000
– – 99,000 120,000
3,828 53 34,084 46,874
– – 38 45
– – 35 40
– – 43 49
52
46
60
479,457
39
34
45
1,700,000
1,600,000
1,500,000
550,791
33
28
38
65
58
74
447,014
51
45
57
1,200,000
1,100,000
1,300,000
473,732
40
35
46
15
13
17
32,421
9
8
11
500,000
430,000
570,000
76,825
15
13
18
13
7
21
350
10
5
17
9,600
6,400
16,000
993
7
4
10
35 63
25 42
47 94
49 7,124
2 30
1 20
3 45
91,000 45,000
82,000 32,000
130,000 64,000
35,266 23,933
39 53
30 41
49 72
86
57
>95
9,438
42
27
57
39,000
33,000
49,000
26,499
67
50
83
87
55
>95
1,143
72
49
>95
12,000
12,000
13,000
9,024
85
80
89
49
41
58
91,737
22
18
25
860,000
770,000
970,000
209,136
28
23
32
52
45
61
497,748
39
34
45
1,900,000
1,700,000
2,100,000
646,852
34
31
39
–
–
–
–
–
–
–
1,900,000
1,700,000
2,100,000
–
–
–
–
Percentage of infants born to pregnant women living with HIV started on cotrimoxazole prophylaxis, 2012: UNAIDS, UNICEF, WHO, 2013 Global AIDS Response Progress Reporting and UNAIDS 2012 HIV and AIDS estimates. Number of infants born to pregnant women living with HIV started on antiretroviral prophylaxis to prevent mother-tochild transmission, 2012: UNAIDS, UNICEF, WHO, 2013 Global AIDS Response Progress Reporting. Percentage of infants born to pregnant women living with HIV started on antiretroviral prophylaxis to prevent mother-to-child transmission, 2012: UNAIDS, UNICEF, WHO, 2013 Global AIDS Response Progress Reporting and UNAIDS 2012 HIV and AIDS estimates. Number of infants born to pregnant women living with HIV receiving virological test for HIV within 2 months of birth, 2012: UNAIDS, UNICEF, WHO, 2013 Global AIDS Response Progress Reporting. Percentage of infants born to pregnant women living with HIV receiving virological test for HIV within 2 months of birth, 2012: UNAIDS, UNICEF, WHO, 2013 Global AIDS Response Progress Reporting, and UNAIDS 2012 HIV and AIDS estimates.
Estimated number of children needing antiretroviral therapy based on UNAIDS/WHO guidelines, 2012: Joint United Nations Programme on HIV/AIDS, Global Report: UNAIDS report on the global AIDS epidemic 2013, UNAIDS, Geneva, 2013. Number of children (aged 0–14) receiving antiretroviral therapy, 2012: Joint United Nations Programme on HIV/AIDS, Global Report: UNAIDS report on the global AIDS epidemic 2013, UNAIDS, Geneva, 2013. Estimated antiretroviral therapy coverage among children (aged 0–14), 2012: Joint United Nations Programme on HIV/AIDS, Global Report: UNAIDS report on the global AIDS epidemic 2013, UNAIDS, Geneva, 2013.
NOTES
– Data not available. * Data refer to the most recent year available during the period specified in the column heading. ** Excludes China. ǂ Regional averages are calculated only when the population represents 50 per cent or more of the region’s total population of interest.
x Data refer to years or periods other than those specified in the column heading. Such data are not included in the calculation of regional and global averages, with the exception of 2005–2006 India. Estimates from years prior to 2005 are not displayed. y Data differ from the standard definition or refer to only part of a country. If they fall within the reference period, such data are included in the calculation of regional and global averages. p Based on small denominators (typically 25–29 unweighted cases). No data based on fewer than 25 unweighted cases are displayed. a/ Sub-Saharan Africa includes the Sudan and Djibouti. Some estimates do not add up to the totals because of rounding. Low- and middle-income countries are classified as such by the World Bank as of July 2013; these countries form the basis for the data analysis in UNAIDS, UNICEF and WHO.
65