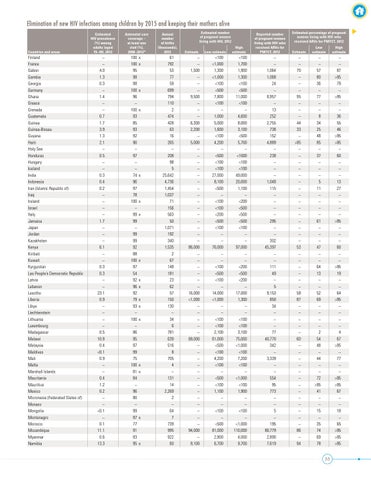
Elimination of new HIV infections among children by 2015 and keeping their mothers alive
Countries and areas
Finland France Gabon Gambia Georgia Germany Ghana Greece Grenada Guatemala Guinea Guinea-Bissau Guyana Haiti Holy See Honduras Hungary Iceland India Indonesia Iran (Islamic Republic of) Iraq Ireland Israel Italy Jamaica Japan Jordan Kazakhstan Kenya Kiribati Kuwait Kyrgyzstan Lao People’s Democratic Republic Latvia Lebanon Lesotho Liberia Libya Liechtenstein Lithuania Luxembourg Madagascar Malawi Malaysia Maldives Mali Malta Marshall Islands Mauritania Mauritius Mexico Micronesia (Federated States of) Monaco Mongolia Montenegro Morocco Mozambique Myanmar Namibia
Estimated HIV prevalence (%) among adults (aged 15–49), 2012
– – 4.0 1.3 0.3 – 1.4 – – 0.7 1.7 3.9 1.3 2.1 – 0.5 – – 0.3 0.4 0.2 – – – – 1.7 – – – 6.1 – – 0.3 0.3 – – 23.1 0.9 – – – – 0.5 10.8 0.4 <0.1 0.9 – – 0.4 1.2 0.2 – – <0.1 – 0.1 11.1 0.6 13.3
Antenatal care coverage – at least one visit (%), 2008–2012*
100 100 95 98 98 100 96 – 100 93 85 93 92 90 – 97 – – 74 96 97 78 100 – 99 99 – 99 99 92 88 100 97 54 92 96 92 79 93 – 100 – 86 95 97 99 75 100 81 84 – 96 80 – 99 97 77 91 83 95
x x
x
x
x
x x
x
x x x x x
x x
x
x
Annual number of births (thousands), 2012
61 792 53 77 59 699 794 110 2 474 428 63 16 265 – 208 98 5 25,642 4,736 1,454 1,037 71 156 563 50 1,071 192 340 1,535 2 67 148 181 23 62 57 150 130 – 34 6 781 639 516 8 705 4 – 131 14 2,269 2 – 64 7 739 995 922 60
Estimated number of pregnant women living with HIV, 2012 Estimate
– – 1,500 – – – 9,500 – – – 6,300 2,200 – 5,000 – – – – – – – – – – – – – – – 86,000 – – – – – – 16,000 <1,000 – – – – – 68,000 – – – – – – – – – – – – – 94,000 – 8,100
Low estimate
<100 <1,000 1,300 <1,000 <100 <500 7,800 <100 – 1,000 5,000 1,600 <100 4,200 – <500 <100 <100 27,000 8,100 <500 – <100 <100 <200 <500 <100 – – 76,000 – – <100 <500 <100 – 14,000 <1,000 – – <100 <100 2,100 61,000 <500 <100 4,200 <100 – <500 <100 1,100 – – <100 – <500 81,000 2,800 6,700
High estimate
<100 1,700 1,900 1,300 <100 <500 11,000 <100 – 4,600 8,000 3,100 <500 5,700 – <1000 <100 <100 49,000 20,000 1,100 – <200 <500 <500 <500 <100 – – 97,000 – – <200 <500 <200 – 17,000 1,300 – – <100 <100 3,100 75,000 <1,000 <100 7,200 <100 – <1,000 <100 1,900 – – <100 – <1,000 110,000 4,000 9,700
Reported number of pregnant women living with HIV who received ARVs for PMTCT, 2012
– – 1,064 1,068 24 – 8,957 – 13 252 2,755 738 152 4,889 – 238 – – – 1,048 115 – – – – 295 – – 302 45,397 – – 111 49 – 5 9,153 850 34 – – – 77 40,770 342 – 3,339 – – 554 95 773 – – 5 – 195 80,779 2,890 7,619
Estimated percentage of pregnant women living with HIV who received ARVs for PMTCT, 2012 Estimate
– – 70 – – – 95 – – – 44 33 – >95 – – – – – – – – – – – – – – – 53 – – – – – – 58 87 – – – – – 60 – – – – – – – – – – – – – 86 – 94
Low estimate
– – 57 80 36 – 77 – – 8 34 25 48 85 – 37 – – – 5 11 – – – – 61 – – – 47 – – 64 13 – – 52 69 – – – – 2 54 48 – 44 – – 72 >95 41 – – 15 – 35 74 69 78
High estimate
– – 87 >95 79 – >95 – – 36 55 46 >95 >95 – 60 – – – 13 27 – – – – >95 – – – 60 – – >95 19 – – 64 >95 – – – – 4 67 >95 – 77 – – >95 >95 67 – – 18 – 65 >95 >95 >95 55