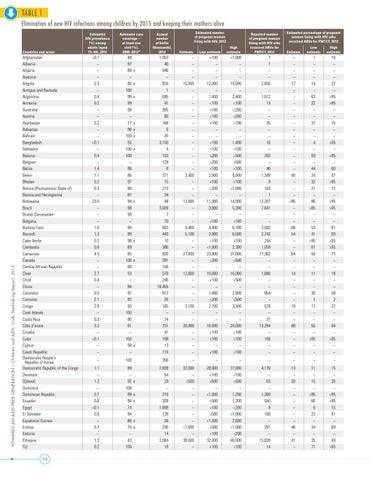
TABLE 1 Elimination of new HIV infections among children by 2015 and keeping their mothers alive
TOWARDS AN AIDS-FREE GENERATION – Children and AIDS: Sixth Stocktaking Report, 2013
Countries and areas
Afghanistan Albania Algeria Andorra Angola Antigua and Barbuda Argentina Armenia Australia Austria Azerbaijan Bahamas Bahrain Bangladesh Barbados Belarus Belgium Belize Benin Bhutan Bolivia (Plurinational State of) Bosnia and Herzegovina Botswana Brazil Brunei Darussalam Bulgaria Burkina Faso Burundi Cabo Verde Cambodia Cameroon Canada Central African Republic Chad Chile China Colombia Comoros Congo Cook Islands Costa Rica Côte d’Ivoire Croatia Cuba Cyprus Czech Republic Democratic People’s Republic of Korea Democratic Republic of the Congo Denmark Djibouti Dominica Dominican Republic Ecuador Egypt El Salvador Equatorial Guinea Eritrea Estonia Ethiopia Fiji 54
Estimated HIV prevalence (%) among adults (aged 15–49), 2012
Antenatal care coverage – at least one visit (%), 2008–2012*
Annual number of births (thousands), 2012
Estimate
356
–
–
–
–
–
–
–
89 – 92 100 99 84 74 94 86 70 – 43 100
2,839 64 24 – 218 328 1,898 128 26 230 14 3,084 18
32,000 – <500 – – – – – – <1,000 – 38,000 –
28,000 <100 <500 – <1,000 <500 <100 <500 <1,000 <500 <100 32,000 <100
37,000 <100 <500 – 1,200 1,200 <200 <1,000 2,600 <1,000 <200 46,000 <100
4,176 – 63 – 1,300 550 9 166 – 291 – 15,828 14
13 – 20 – – – – – – 46 – 41 –
11 – 15 – >95 60 6 23 – 34 – 35 71
15 – 26 – >95 >95 15 81 – 69 – 49 >95
x
x
x
x
x x x
x x
– – – – 17 – – – – – – – – – – – – – 40 – – – >95 – – – 66 54 – – 64 – – 14 – – – – 19 – – 68 – – – –
1 – – – 14 – 63 22 – – 37 – – 4 – 83 – 44 34 32 21 – 86 >95 – – 53 41 >95 61 56 – – 11 – – 30 1 17 – – 55 – >95 – –
High estimate
100
x
7 1 – – 2,656 – 1,612 13 – – 35 – – 16 – 203 – 40 1,349 9 163 1 12,207 7,641 – – 3,582 2,742 244 1,058 17,362 – – 1,680 – – 854 – 579 – 37 13,294 – 106 – –
Low estimate
–
x x x
<1,000 – – – 19,000 – 2,400 <100 <200 <200 <100 – – 1,400 <100 <500 <500 <100 4,000 <100 <1,000 – 14,000 5,300 – <100 6,700 6,500 <100 2,300 31,000 <500 – 16,000 <500 – 2,800 <500 3,500 – – 24,000 <100 <100 – <100
Estimate
1.1 – 1.2 – 0.7 0.6 <0.1 0.6 – 0.7 – 1.3 0.2
x
<100 – – – 12,000 – 1,400 <100 <100 <100 <100 – – <100 <100 <200 <200 <100 2,900 <100 <200 – 11,000 3,900 – <100 4,400 3,900 <100 <1,000 23,000 <200 – 10,000 <100 – 1,400 <200 2,700 – – 16,000 <100 <100 – <100
High estimate
Estimated percentage of pregnant women living with HIV who received ARVs for PMTCT, 2012
48 97 89 – 80 100 99 99 98 – 77 98 100 55 100 100 – 96 86 97 86 87 94 98 99 – 94 99 98 89 85 100 68 53 – 94 97 92 93 100 90 91 – 100 99 –
x
– – – – 15,000 – – – – – – – – – – – – – 3,400 – – – 13,000 – – – 5,400 5,100 – – 27,000 – – 12,000 – – – – 3,100 – – 20,000 – – – –
Low estimate
Reported number of pregnant women living with HIV who received ARVs for PMTCT, 2012
<0.1 – – – 2.3 – 0.4 0.2 – – 0.2 – – <0.1 – 0.4 – 1.4 1.1 0.2 0.3 – 23.0 – – – 1.0 1.3 0.2 0.8 4.5 – – 2.7 0.4 – 0.5 2.1 2.8 – 0.3 3.2 – <0.1 – –
x
1,053 40 946 – 934 1 695 41 305 80 168 6 20 3,150 4 103 129 8 371 15 273 34 48 3,009 7 70 683 443 10 386 820 391 156 579 246 18,455 912 26 165 – 74 731 41 108 13 118
Estimated number of pregnant women living with HIV, 2012
10 – – – 22 – >95 >95 – – 75 – – >95 – >95 – 60 47 >95 72 – >95 >95 – – 81 69 >95 >95 73 – – 18 – – 59 2 22 – – 84 – >95 – –