Monitoring ICPD Demographic indicators Goals – Selected Indicators Population Country, territory or other area
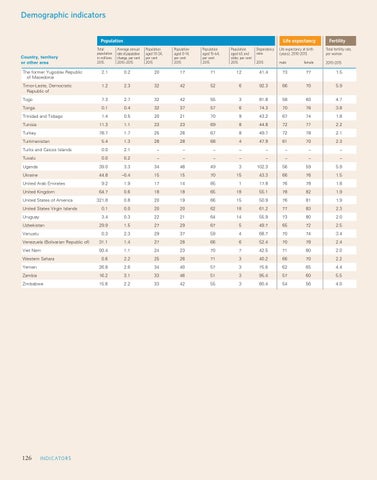
Total population in millions 2015
Life expectancy
Average annual rate of population change, per cent 2010–2015
Population aged 10-24, per cent 2015
Population aged 0-14, per cent 2015
Population aged 15-64, per cent 2015
Population aged 65 and older, per cent 2015
Fertility
Dependency ratio
Life expectancy at birth (years), 2010-2015
Total fertility rate, per woman
2015
male
2010-2015
female
The former Yugoslav Republic of Macedonia
2.1
0.2
20
17
71
12
41.4
73
77
1.5
Timor-Leste, Democratic Republic of
1.2
2.3
32
42
52
6
92.3
66
70
5.9
Togo
7.3
2.7
32
42
55
3
81.8
58
60
4.7
Tonga
0.1
0.4
32
37
57
6
74.3
70
76
3.8
Trinidad and Tobago
1.4
0.5
20
21
70
9
43.2
67
74
1.8
Tunisia
11.3
1.1
23
23
69
8
44.8
72
77
2.2
Turkey
78.7
1.7
25
26
67
8
49.7
72
78
2.1
5.4
1.3
28
28
68
4
47.9
61
70
2.3
Turkmenistan Turks and Caicos Islands
0.0
2.1
–
–
–
–
–
–
–
–
Tuvalu
0.0
0.2
–
–
–
–
–
–
–
–
Uganda
39.0
3.3
34
48
49
3
102.3
56
59
5.9
Ukraine
44.8
–0.4
15
15
70
15
43.3
66
76
1.5
9.2
1.9
17
14
85
1
17.8
76
78
1.8
United Arab Emirates United Kingdom United States of America United States Virgin Islands Uruguay Uzbekistan Vanuatu
64.7
0.6
18
18
65
18
55.1
78
82
1.9
321.8
0.8
20
19
66
15
50.9
76
81
1.9
0.1
0.0
20
20
62
18
61.2
77
83
2.3
3.4
0.3
22
21
64
14
55.9
73
80
2.0
29.9
1.5
27
29
67
5
49.7
65
72
2.5
0.3
2.3
29
37
59
4
68.7
70
74
3.4
Venezuela (Bolivarian Republic of)
31.1
1.4
27
28
66
6
52.4
70
78
2.4
Viet Nam
93.4
1.1
24
23
70
7
42.5
71
80
2.0
Western Sahara Yemen
0.6
2.2
25
26
71
3
40.2
66
70
2.2
26.8
2.6
34
40
57
3
75.6
62
65
4.4
Zambia
16.2
3.1
33
46
51
3
95.4
57
60
5.5
Zimbabwe
15.6
2.2
33
42
55
3
80.4
54
56
4.0
126126
I ND ICATO R S