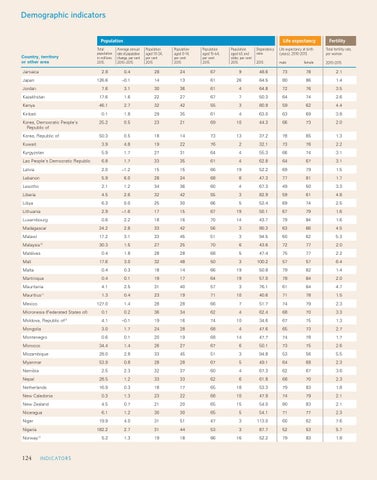
Monitoring ICPD Demographic indicators Goals – Selected Indicators Population Country, territory or other area Jamaica
Total population in millions 2015
Life expectancy
Average annual rate of population change, per cent 2010–2015
Population aged 10-24, per cent 2015
Population aged 65 and older, per cent 2015
Fertility
Dependency ratio
Life expectancy at birth (years), 2010-2015
Total fertility rate, per woman
2015
male
2010-2015
48.6
73
female
0.4
126.6
–0.1
14
7.6
3.1
30
Kazakhstan
17.6
1.6
22
27
Kenya
46.1
2.7
32
42
55
3
80.9
59
62
4.4
Kiribati
0.1
1.8
29
35
61
4
63.0
63
69
3.8
Korea, Democratic People's Republic of
25.2
0.5
23
21
69
10
44.3
66
73
2.0
Korea, Republic of
Japan
24
Population aged 15-64, per cent 2015
2.8
Jordan
28
Population aged 0-14, per cent 2015
67
9
78
2.1
13
61
26
64.5
80
86
1.4
36
61
4
64.8
72
76
3.5
67
7
50.3
64
74
2.6
50.3
0.5
18
14
73
13
37.2
78
85
1.3
Kuwait
3.9
4.8
19
22
76
2
32.1
73
76
2.2
Kyrgyzstan
5.9
1.7
27
31
64
4
55.3
66
74
3.1
Lao People's Democratic Republic
6.8
1.7
33
35
61
4
62.8
64
67
3.1
Latvia
2.0
–1.2
15
15
66
19
52.2
69
79
1.5
Lebanon
5.9
6.0
28
24
68
8
47.3
77
81
1.7
Lesotho
2.1
1.2
34
36
60
4
67.3
49
50
3.3
Liberia
4.5
2.6
32
42
55
3
82.9
59
61
4.8
Libya
6.3
0.0
25
30
66
5
52.4
69
74
2.5
Lithuania
2.9
–1.6
17
15
67
19
50.1
67
79
1.6
Luxembourg
0.6
2.2
18
16
70
14
43.7
79
84
1.6
Madagascar
24.2
2.8
33
42
56
3
80.3
63
66
4.5
Malawi
17.2
3.1
33
45
51
3
94.5
60
62
5.3
Malaysia
10
Maldives Mali
30.3
1.5
27
25
70
6
43.6
72
77
2.0
0.4
1.8
28
28
68
5
47.4
75
77
2.2
17.6
3.0
32
48
50
3
100.2
57
57
6.4
Malta
0.4
0.3
18
14
66
19
50.8
79
82
1.4
Martinique
0.4
0.1
19
17
64
19
57.0
78
84
2.0
Mauritania
4.1
2.5
31
40
57
3
76.1
61
64
4.7
Mauritius11
1.3
0.4
23
19
71
10
40.6
71
78
1.5
127.0
1.4
28
28
66
7
51.7
74
79
2.3
Micronesia (Federated States of)
Mexico
0.1
0.2
36
34
62
4
62.4
68
70
3.3
Moldova, Republic of12
4.1
–0.1
19
16
74
10
34.6
67
75
1.3
Mongolia
3.0
1.7
24
28
68
4
47.6
65
73
2.7
Montenegro
0.6
0.1
20
19
68
14
47.7
74
78
1.7
34.4
1.4
26
27
67
6
50.1
73
75
2.6
Morocco Mozambique
28.0
2.8
33
45
51
3
94.8
53
56
5.5
Myanmar
53.9
0.8
28
28
67
5
49.1
64
68
2.3
2.5
2.3
32
37
60
4
67.3
62
67
3.6
Namibia Nepal
28.5
1.2
33
33
62
6
61.8
68
70
2.3
Netherlands
16.9
0.3
18
17
65
18
53.3
79
83
1.8
New Caledonia
0.3
1.3
23
22
68
10
47.9
74
79
2.1
New Zealand
4.5
0.7
21
20
65
15
54.0
80
83
2.1
Nicaragua Niger Nigeria Norway
13
124
124124
I NDI CATORS
CATO I NDI NDI ICATO RS RS
6.1
1.2
30
30
65
5
54.1
71
77
2.3
19.9
4.0
31
51
47
3
113.0
60
62
7.6
182.2
2.7
31
44
53
3
87.7
52
53
5.7
5.2
1.3
19
18
66
16
52.2
79
83
1.8