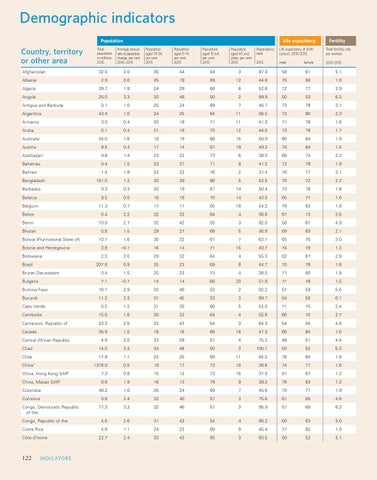
Monitoring ICPD Goals – Selected Indicators Demographic indicators Population
Country, territory or other area Afghanistan
Total population in millions 2015
32.5
Life expectancy
Average annual rate of population change, per cent 2010–2015
3.0
Population aged 10-24, per cent 2015
35
Population aged 0-14, per cent 2015
44
Population aged 15-64, per cent 2015
Population aged 65 and older, per cent 2015
54
3
Fertility
Dependency ratio
Life expectancy at birth (years), 2010-2015
Total fertility rate, per woman
2015
male
2010-2015
87.0
59
female
61
5.1
Albania
2.9
0.0
25
19
69
12
44.8
75
80
1.8
Algeria
39.7
1.9
24
29
66
6
52.6
72
77
2.9
Angola
25.0
3.3
33
48
50
2
99.9
50
53
6.2
0.1
1.0
25
24
69
7
45.7
73
78
2.1
Argentina
Antigua and Barbuda
43.4
1.0
24
25
64
11
56.5
72
80
2.3
Armenia
3.0
0.4
20
18
71
11
41.3
71
78
1.6 1.7
Aruba
0.1
0.4
21
18
70
12
44.0
73
78
24.0
1.6
19
19
66
15
50.9
80
84
1.9
Austria
8.5
0.4
17
14
67
19
49.2
78
84
1.5
Azerbaijan2
9.8
1.4
23
22
73
6
38.0
68
74
2.3
Australia1
Bahamas
0.4
1.5
23
21
71
8
41.2
72
78
1.9
Bahrain
1.4
1.8
22
22
76
2
31.4
76
77
2.1
161.0
1.2
30
29
66
5
52.5
70
72
2.2
Bangladesh Barbados
0.3
0.3
20
19
67
14
50.4
73
78
1.8
Belarus
9.5
0.0
16
16
70
14
43.0
65
77
1.6
Belgium
11.3
0.7
17
17
65
18
54.2
78
83
1.8
Belize
0.4
2.2
32
33
64
4
56.8
67
73
2.6
Benin
10.9
2.7
32
42
55
3
82.0
58
61
4.9
Bhutan
0.8
1.5
29
27
68
5
46.9
69
69
2.1
10.7
1.6
30
32
61
7
63.7
65
70
3.0
Bosnia and Herzegovina
3.8
–0.1
16
14
71
15
40.7
74
79
1.3
Botswana
2.3
2.0
29
32
64
4
55.3
62
67
2.9
207.8
0.9
25
23
69
8
44.7
70
78
1.8
Bolivia (Plurinational State of)
Brazil Brunei Darussalam
0.4
1.5
25
23
73
4
38.0
77
80
1.9
Bulgaria
7.1
–0.7
14
14
66
20
51.9
71
78
1.5
Burkina Faso
18.1
2.9
33
46
52
2
92.2
57
59
5.6
Burundi
11.2
3.3
31
45
53
3
89.7
54
58
6.1
0.5
1.2
31
30
66
5
52.0
71
75
2.4
15.6
1.6
30
32
64
4
55.6
66
70
2.7
Cabo Verde Cambodia Cameroon, Republic of
23.3
2.5
33
43
54
3
84.3
54
56
4.8
Canada
35.9
1.0
18
16
68
16
47.3
80
84
1.6
Central African Republic Chad Chile China3 China, Hong Kong SAR4 China, Macao SAR
4.9
2.0
33
39
57
4
75.2
48
51
4.4
14.0
3.3
34
48
50
3
100.7
50
52
6.3
17.9
1.1
22
20
69
11
45.2
78
84
1.8
1376.0
0.5
19
17
73
10
36.6
74
77
1.6
7.3
0.8
15
12
73
15
37.0
81
87
1.2
0.6
1.9
16
13
78
9
28.2
78
83
1.2
Colombia
48.2
1.0
26
24
69
7
45.6
70
77
1.9
Comoros
0.8
2.4
32
40
57
3
75.6
61
65
4.6
77.3
3.2
32
46
51
3
95.9
57
60
6.2
5
Congo, Democratic Republic of the Congo, Republic of the
4.6
2.6
31
43
54
4
86.2
60
63
5.0
Costa Rica
4.8
1.1
24
22
69
9
45.4
77
82
1.9
22.7
2.4
33
43
55
3
83.5
50
52
5.1
Côte d'Ivoire
122 122
I NDI CATORS
I ND ICATO R S