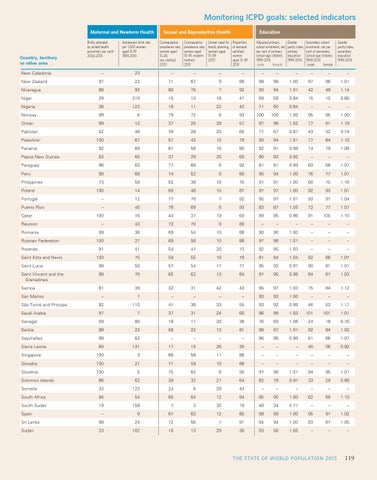
Monitoring ICPD Goals – Selected Monitoring ICPD goals: selected Indicators indicators Maternal and Newborn Health
Country, territory or other area New Caledonia New Zealand
Births attended by skilled health personnel, per centa 2006-2014
Adolescent birth rate per 1,000 women aged 15-19 1999-2014
Sexual and Reproductive Health Contraceptive prevalence rate, women aged 15-49, any method 2015†
Contraceptive prevalence rate, women aged 15-49, modern method 2015†
Unmet need for family planning, women aged 15-49 2015†
Education Proportion of demand satisfied, women aged 15-49 2015†
Adjusted primary school enrolment, net per cent of primary school-age children, 1999-2014 male female
Gender parity index, primary education 1999-2014
Secondary school enrolment, net per cent of secondary school-age children, 1999-2014 male female
Gender parity index, secondary education 1999-2014
–
23
–
–
–
–
–
–
–
–
–
–
97
22
71
67
9
89
98
98
1.00
97
98
1.01
Nicaragua
88
92
80
75
7
92
93
94
1.01
42
49
1.14
Niger
29
210
15
10
18
47
69
58
0.84
15
10
0.66
Nigeria
38
123
16
11
22
42
71
60
0.84
–
–
–
Norway
99
6
79
72
6
93
100
100
1.00
95
95
1.00
Oman
99
12
37
25
28
57
97
98
1.02
77
91
1.19
Pakistan
52
48
39
28
20
65
77
67
0.87
43
32
0.74
100
67
57
43
15
79
93
94
1.01
77
84
1.10 1.08
Palestine1 Panama
92
89
61
58
16
80
92
91
0.99
74
79
Papua New Guinea
53
65
37
29
25
60
90
83
0.92
–
–
–
Paraguay
96
63
77
68
6
92
81
81
0.99
63
68
1.07
Peru
90
68
74
52
9
89
95
94
1.00
76
77
1.01
Philippines
73
59
55
38
18
75
91
91
1.00
60
70
1.16
100
14
69
48
10
87
97
97
1.00
92
93
1.01
Poland Portugal
–
12
77
70
7
92
95
97
1.01
93
97
1.04
Puerto Rico
–
45
78
69
6
93
83
87
1.05
72
77
1.07
Qatar Reunion Romania Russian Federation Rwanda Saint Kitts and Nevis
100
16
44
37
19
69
99
95
0.96
91
100
1.10
–
43
72
70
9
89
–
–
–
–
–
–
99
36
69
54
10
88
90
90
1.00
–
–
–
100
27
69
56
10
88
97
98
1.01
–
–
–
91
41
54
47
20
73
92
95
1.03
–
–
–
100
75
59
55
16
79
81
84
1.04
82
88
1.07
Saint Lucia
99
50
57
54
17
77
95
93
0.97
80
81
1.01
Saint Vincent and the Grenadines
99
70
65
62
13
84
97
95
0.98
84
87
1.03
Samoa
81
39
32
31
42
43
95
97
1.03
75
84
1.12
–
1
–
–
–
–
93
93
1.00
–
–
–
82
110
41
36
33
55
93
92
0.99
46
53
1.17
San Marino São Tomé and Príncipe Saudi Arabia
97
7
37
31
24
60
96
99
1.03
101
101
1.01
Senegal
59
80
18
17
30
38
76
83
1.08
24
18
0.76
Serbia
98
22
58
22
13
81
96
97
1.01
92
94
1.03
Seychelles
99
62
–
–
–
–
96
95
0.99
61
66
1.07
60
131
17
15
26
39
–
–
–
40
36
0.92
Singapore
Sierra Leone
100
3
66
58
11
86
–
–
–
–
–
–
Slovakia
100
21
71
59
10
88
–
–
–
–
–
–
Slovenia
100
5
75
64
8
90
97
98
1.01
94
95
1.01
Solomon Islands
86
62
39
32
21
64
82
79
0.97
33
29
0.88
Somalia
33
123
24
6
29
44
–
–
–
–
–
– 1.10
South Africa
94
54
65
64
12
84
95
95
1.00
62
69
South Sudan
19
158
7
3
30
19
48
34
0.71
–
–
–
–
9
67
63
12
85
98
99
1.00
95
97
1.02
Spain Sri Lanka
99
24
72
56
7
91
94
94
1.00
83
87
1.05
Sudan
23
102
16
13
29
36
53
56
1.05
–
–
–
STAT EOF OF WORLD WOR L D POPU L AT ION 20 1201 2 5 THE STATE POPULATION
119 119