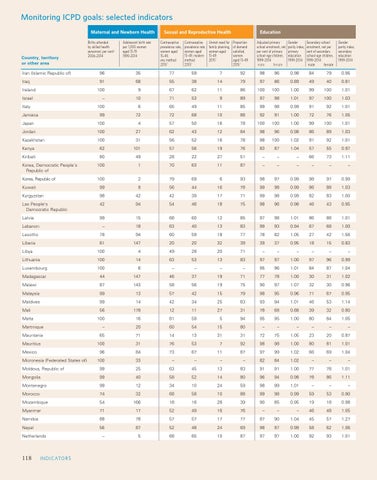
Monitoring Selectedindicators Indicators Monitoring ICPD ICPD Goals goals: –selected Maternal and Newborn Health
Country, territory or other area
Births attended by skilled health personnel, per centa 2006-2014
Adolescent birth rate per 1,000 women aged 15-19 1999-2014
Sexual and Reproductive Health Contraceptive prevalence rate, women aged 15-49, any method 2015†
Contraceptive prevalence rate, women aged 15-49, modern method 2015†
Unmet need for family planning, women aged 15-49 2015†
Education Proportion of demand satisfied, women aged 15-49 2015†
Adjusted primary school enrolment, net per cent of primary school-age children, 1999-2014 male female
Gender parity index, primary education 1999-2014
Secondary school enrolment, net per cent of secondary school-age children, 1999-2014 male female
Gender parity index, secondary education 1999-2014
Iran (Islamic Republic of)
96
35
77
59
7
92
98
96
0.98
84
79
0.95
Iraq
91
68
55
38
14
79
97
86
0.89
49
40
0.81
Ireland Israel Italy Jamaica
100
9
67
62
11
86
100
100
1.00
99
100
1.01
–
10
71
53
9
89
97
98
1.01
97
100
1.03
100
6
65
49
11
85
99
98
0.99
91
92
1.01
99
72
72
68
10
88
92
91
1.00
72
76
1.05
Japan
100
4
57
50
16
78
100
100
1.00
99
100
1.01
Jordan
100
27
62
43
12
84
98
96
0.98
86
89
1.03
Kazakhstan
100
31
56
52
16
78
98
100
1.02
91
92
1.01
Kenya
62
101
57
56
19
76
83
87
1.04
57
55
0.97
Kiribati
80
49
28
22
27
51
–
–
–
66
73
1.11
Korea, Democratic People's Republic of
100
1
70
63
11
87
–
–
–
–
–
–
Korea, Republic of
100
2
79
69
6
93
98
97
0.99
98
97
0.99
Kuwait
99
8
56
44
16
78
99
98
0.99
86
88
1.03
Kyrgyzstan
98
42
42
39
17
71
99
98
0.99
82
83
1.00
Lao People's Democratic Republic
42
94
54
46
18
75
98
96
0.98
46
43
0.95
Latvia
99
15
68
60
12
85
97
98
1.01
86
88
1.01
–
18
63
40
13
83
99
93
0.94
67
68
1.00
Lebanon Lesotho
78
94
60
59
18
77
78
82
1.05
27
42
1.56
Liberia
61
147
20
20
32
39
39
37
0.95
18
15
0.83
100
4
49
28
20
71
–
–
–
–
–
–
Lithuania
100
14
63
53
13
83
97
97
1.00
97
96
0.99
Luxembourg
100
6
–
–
–
–
95
96
1.01
84
87
1.04
Libya
Madagascar
44
147
46
37
19
71
77
78
1.00
30
31
1.02
Malawi
87
143
58
56
19
75
90
97
1.07
32
30
0.96
Malaysia
99
13
57
42
15
79
98
95
0.96
71
67
0.95
Maldives
99
14
42
34
25
63
93
94
1.01
46
53
1.14
Mali
56
178
12
11
27
31
78
68
0.88
39
32
0.80 1.05
100
16
81
59
5
94
95
95
1.00
80
84
Martinique
Malta
–
20
60
54
15
80
–
–
–
–
–
–
Mauritania
65
71
14
13
31
31
72
75
1.05
23
20
0.87
Mauritius
100
31
76
53
7
92
98
98
1.00
80
81
1.01
96
84
73
67
11
87
97
99
1.02
66
69
1.04
100
33
–
–
–
–
82
84
1.02
–
–
–
99
25
63
45
13
83
91
91
1.00
77
78
1.01 1.11
Mexico Micronesia (Federated States of) Moldova, Republic of Mongolia
99
40
58
52
14
80
96
94
0.98
78
86
Montenegro
99
12
34
10
24
59
98
99
1.01
–
–
–
Morocco
74
32
68
58
10
88
99
98
0.99
59
53
0.90
Mozambique
54
166
18
16
28
39
90
85
0.95
19
18
0.98
Myanmar
71
17
52
49
16
76
–
–
–
46
48
1.05
Namibia
88
78
57
57
17
77
87
90
1.04
45
57
1.27
Nepal
56
87
52
48
24
69
98
97
0.99
58
62
1.06
–
5
68
65
10
87
97
97
1.00
92
93
1.01
Netherlands
118118
CATORS I NDI NDI ICATO RS