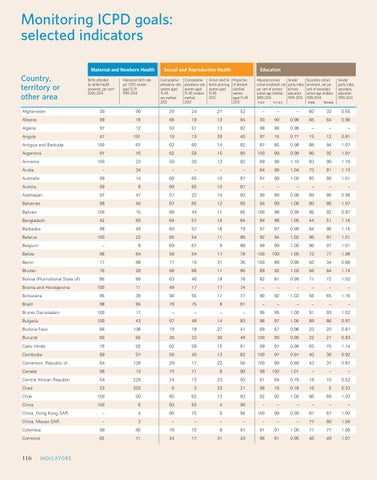
Monitoring ICPD Goals – Selected Indicators
Monitoring ICPD goals: selected indicators Maternal and Newborn Health
Country, territory or other area
Births attended by skilled health personnel, per centa 2006-2014
Adolescent birth rate per 1,000 women aged 15-19 1999-2014
Sexual and Reproductive Health Contraceptive prevalence rate, women aged 15-49, any method 2015†
Contraceptive prevalence rate, women aged 15-49, modern method 2015†
Unmet need for family planning, women aged 15-49 2015†
Education Proportion of demand satisfied, women aged 15-49 2015†
Adjusted primary school enrolment, net per cent of primary school-age children, 1999-2014 male female
Gender parity index, primary education 1999-2014
Secondary school enrolment, net per cent of secondary school-age children, 1999-2014 male female
Gender parity index, secondary education 1999-2014
Afghanistan
39
90
29
24
27
52
–
–
–
60
33
0.55
Albania
99
18
66
19
13
84
93
90
0.96
66
64
0.96
Algeria
97
12
59
51
13
82
98
96
0.98
–
–
–
Angola
47
191
19
13
28
40
97
74
0.77
15
12
0.81
100
67
63
60
14
82
87
85
0.98
88
94
1.07
Antigua and Barbuda Argentina
97
70
62
58
15
80
100
99
0.99
86
92
1.07
Armenia
100
23
59
30
13
82
89
98
1.10
83
96
1.16
Aruba Australia
–
34
–
–
–
–
94
98
1.04
73
81
1.10
99
14
68
65
10
87
97
98
1.00
85
86
1.01
Austria
99
8
68
65
10
87
–
–
–
–
–
–
Azerbaijan
97
47
57
22
14
80
90
88
0.98
88
86
0.98
Bahamas
98
40
67
65
12
85
94
99
1.06
80
86
1.07
100
15
66
43
11
85
100
98
0.99
95
92
0.97
Bangladesh
Bahrain
42
83
64
57
12
84
94
98
1.05
44
51
1.16
Barbados
98
49
60
57
16
79
97
97
0.99
84
96
1.15
100
22
65
54
11
86
92
94
1.02
96
97
1.01
–
8
69
67
9
88
99
99
1.00
96
97
1.01
Belarus Belgium Belize
96
64
58
54
17
78
100
100
1.00
72
77
1.08
Benin
77
98
17
10
31
36
100
88
0.88
50
34
0.68
Bhutan
75
28
68
66
11
86
89
92
1.03
56
64
1.15
Bolivia (Plurinational State of)
85
89
63
40
18
78
82
81
0.99
71
72
1.02
100
11
48
17
17
74
–
–
–
–
–
– 1.16
Bosnia and Herzegovina Botswana
95
39
56
55
17
77
90
92
1.02
56
65
Brazil
98
65
79
75
8
91
–
–
–
–
–
–
Brunei Darussalam
100
17
–
–
–
–
95
95
1.00
91
93
1.02
Bulgaria
100
43
67
48
14
83
96
97
1.00
89
86
0.97
Burkina Faso
66
136
19
18
27
41
69
67
0.96
23
20
0.87
Burundi
60
65
28
23
30
48
100
90
0.90
22
21
0.93
Cabo Verde
78
92
62
58
15
81
99
97
0.98
65
75
1.14
Cambodia
89
57
58
40
13
82
100
97
0.97
40
36
0.92
Cameroon, Republic of
64
128
29
17
22
56
100
89
0.89
43
37
0.87
Canada
98
13
73
71
8
90
99
100
1.01
–
–
–
Central African Republic
54
229
24
13
23
50
81
64
0.79
18
10
0.52
Chad
23
203
6
3
23
21
96
75
0.78
16
5
0.33
Chile
100
50
65
62
13
83
92
92
1.00
86
89
1.03
China
100
6
83
83
4
96
–
–
–
–
–
–
China, Hong Kong SAR
–
4
80
75
5
94
100
99
0.99
87
87
1.00
China, Macao SAR
–
3
–
–
–
–
–
–
–
77
80
1.04
Colombia
99
85
78
72
8
91
91
91
1.00
71
77
1.08
Comoros
82
71
24
17
31
43
86
81
0.95
46
49
1.07
116
CATORS I NDI NDI ICATO RS