Weak health sectors and fragility
Fragile countries have the poorest health indicators, and poor health outcomes can contribute to fragility. But State fragility can in turn cause high disease and mortality rates as a result of ineffective service delivery (Haar and Rubenstein, 2012). The largest Ebola epidemic in history hit West Africa in 2014. The worst-affected countries, Guinea, Liberia and Sierra Leone are fragile States (UNDP, 2015a). A devastating 14-year conflict destroyed much of Liberia’s infrastructure, so by the time the Ebola epidemic began, the health sector was ill-equipped and understaffed to manage the crisis (UNDP, 2015a). Reproductive health indicators are poor in fragile contexts as a result of weakened health service infrastructure and understaffed facilities, which together can lead to reduced access to reproductive health services, supplies and information. Only $1.30 per
capita was spent annually on reproductive health in 18 conflict-affected countries between 2003 and 2006 (Patel, et al. 2009). Crises hobbling development and leading to profound vulnerability
Conflict, violence, instability, extreme poverty and vulnerability to disasters are deeply interrelated conditions, which today prevent more than 1 billion people from enjoying the massive social and economic gains since the end of the Second World War. A complex mix of overlapping hazards contributes to displacement and determines patterns of movement and needs in fragile and conflictaffected countries. Other additional aspects of vulnerability—gender, ethnicity, income and residence—appear to be associated with heightened chances for long-term harm and complicate
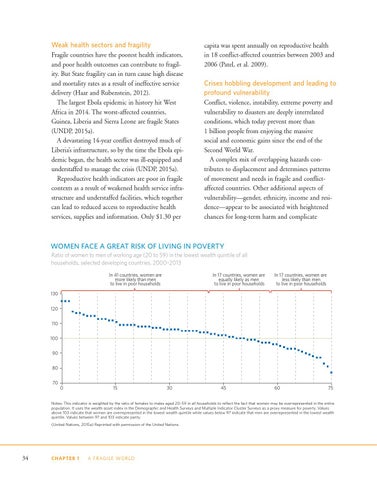
WOMEN FACE A GREAT RISK OF LIVING IN POVERTY Ratio of women to men of working age (20 to 59) in the lowest wealth quintile of all households, selected developing countries, 2000–2013 In 41 countries, women are more likely than men to live in poor households
In 17 countries, women are equally likely as men to live in poor households
In 17 countries, women are less likely than men to live in poor households
130 120 110 100 90 80 70
0
15
30
45
60
75
Notes: This indicator is weighted by the ratio of females to males aged 20–59 in all households to reflect the fact that women may be overrepresented in the e ntire population. It uses the wealth asset index in the Demographic and Health Surveys and Multiple Indicator Cluster Surveys as a proxy measure for poverty. Values above 103 indicate that women are overrepresented in the lowest wealth quintile while values below 97 indicate that men are overrepresented in the lowest wealth quintile. Values between 97 and 103 indicate parity. (United Nations, 2015a) Reprinted with permission of the United Nations.
34
CHAPTER 1
A FRAG I LE WO RLD