114%
Global increase in the number of people exposed to flooding between 1970 and 2010. The world’s population increased by 87% in the same period.25
Underlying drivers, such as poverty, badly planned and managed urban and regional development, and ecosystem decline, are increasing the risk of disaster from these events (figure 5). For example, the earthquake that killed more than 200,000 people in Haiti in 2010 was devastating not just because of its strength (a much stronger earthquake in Chile the same year killed less than 500 people), but because of a failure to enforce minimal building standards. Moreover, the earthquake hit people still recovering from previous crises, including hurricanes, political violence and the 2007/8 food-price crisis, and who were living in a critically degraded environment.26
Figure 6
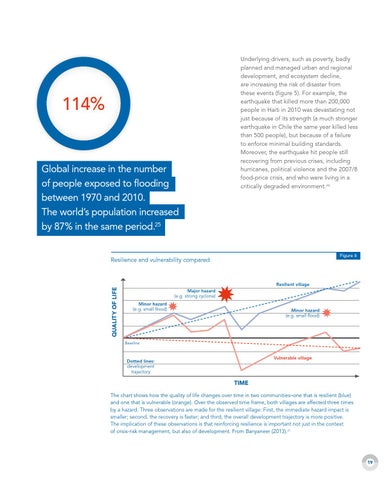
Resilience and vulnerability compared
Quality of life
Resilient village Major hazard (e.g. strong cyclone) Minor hazard (e.g. small flood)
Minor hazard (e.g. small flood)
Baseline
Vulnerable village
Dotted lines: development trajectory
Time The chart shows how the quality of life changes over time in two communities–one that is resilient (blue) and one that is vulnerable (orange). Over the observed time frame, both villages are affected three times by a hazard. Three observations are made for the resilient village: First, the immediate hazard impact is smaller; second, the recovery is faster; and third, the overall development trajectory is more positive. The implication of these observations is that reinforcing resilience is important not just in the context of crisis-risk management, but also of development. From Banyaneer (2013).27
19
19