HUMAN DEVELOPMENT REPORT 2014 Sustaining Human Progress Reducing Vulnerabilities and Building Resilience
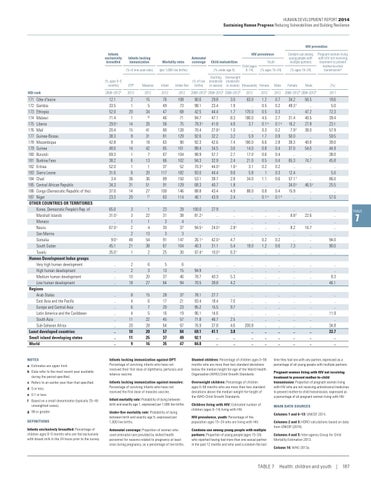
HIV prevention Infants exclusively breastfed
Infants lacking immunization
Mortality rates
(% of one-year-olds)
(per 1,000 live births)
Antenatal coverage
(% ages 15–24)
(% ages 15–24)
HIV prevalence Child malnutrition (% under age 5)
Child (ages 0–14)
Stunting Overweight (moderate (moderate or severe) or severe) (thousands) Female
(% ages 0–5 months)
DTP
Measles
Infant
Under-five
2008–2012b
2012
2012
2012
2012
171 Côte d'Ivoire 172 Gambia 173 Ethiopia 174 Malawi 175 Liberia 176 Mali 177 Guinea-Bissau 178 Mozambique 179 Guinea 180 Burundi 181 Burkina Faso 182 Eritrea 183 Sierra Leone 184 Chad 185 Central African Republic 186 Congo (Democratic Republic of the) 187 Niger OTHER COUNTRIES OR TERRITORIES Korea, Democratic People’s Rep. of Marshall Islands Monaco Nauru San Marino Somalia South Sudan Tuvalu Human Development Index groups Very high human development High human development Medium human development Low human development Regions Arab States East Asia and the Pacific Europe and Central Asia Latin America and the Caribbean South Asia Sub-Saharan Africa Least developed countries Small island developing states World
12.1 33.5 52.0 71.4 29.0 c 20.4 38.3 42.8 48.0 69.3 38.2 52.0 31.6 3.4 34.3 37.0 23.3
2 1 20 1 14 15 8 9 14 1 6 1 6 36 31 14 20
15 5 34
76 49 47 46 56 80 81 63 65 67 66 37 117 89 91 100 63
108 73 68 71 75 128 129 90 101 104 102 52 182 150 129 146 114
90.6 98.1 42.5 94.7 79.3 c 70.4 92.6 92.3 88.4 98.9 94.3 70.3 c 93.0 53.1 68.3 88.8 46.1
29.8 23.4 44.4 47.1 41.8 27.8 c 32.2 42.6 34.5 57.7 32.9 44.0 c 44.4 38.7 40.7 43.4 43.9
65.0 31.0 c .. 67.0 c .. 9.0 c 45.1 35.0 c
3 3 1 2 2 48 21 1
1 22 1 4 13 54 38 2
23 31 3 30 3 91 67 25
29 38 4 37 3 147 104 30
100.0 81.2 c .. 94.5 c .. 26.1 c 40.3 97.4 c
.. .. .. ..
2 2 10 18
6 3 20 27
5 13 37 64
6 15 46 94
.. .. .. .. .. .. .. .. ..
8 4 6 4 11 20 10 11 9
15 6 7 5 22 28 20 25 16
28 17 20 16 45 64 57 37 35
37 21 23 19 57 97 84 49 47
NOTES
Infants lacking immunization against DPT: Percentage of surviving infants who have not received their first dose of diphtheria, pertussis and tetanus vaccine.
Stunted children: Percentage of children ages 0–59 months who are more than two standard deviations below the median height-for-age of the World Health Organization (WHO) Child Growth Standards.
Infants lacking immunization against measles: Percentage of surviving infants who have not received the first dose of measles vaccine.
Overweight children: Percentage of children ages 0−59 months who are more than two standard deviations above the median weight-for-height of the WHO Child Growth Standards.
HDI rank
a Estimates are upper limit. b Data refer to the most recent year available during the period specified. c Refers to an earlier year than that specified. d 5 or less. e 0.1 or less.
10
20 41 31 18 42 7 13 1 20 36 51 27 27
f Based on a small denominator (typically 25–49 unweighted cases).
Infant mortality rate: Probability of dying between birth and exactly age 1, expressed per 1,000 live births.
g 99 or greater.
Under-five mortality rate: Probability of dying between birth and exactly age 5, expressed per 1,000 live births.
DEFINITIONS Infants exclusively breastfed: Percentage of children ages 0–5 months who are fed exclusively with breast milk in the 24 hours prior to the survey.
Antenatal coverage: Proportion of women who used antenatal care provided by skilled health personnel for reasons related to pregnancy at least once during pregnancy, as a percentage of live births.
(% of live births)
Youth
Condom use among young people with multiple partners
2008–2012b 2008–2012b 2008–2012b
Male
Female
Pregnant women living with HIV not receiving treatment to prevent mother‑to‑child transmissiona
Male
2008–2012b 2008–2012b
(%)
2012
2012
2012
3.0 1.9 1.7 8.3 4.6 1.0 3.2 7.4 3.6 2.7 2.4 1.6 c 9.6 2.8 1.8 4.9 2.4
63.0 .. 170.0 180.0 3.7 .. 5.9 180.0 14.0 17.0 21.0 3.1 5.8 34.0 .. 88.0 ..
1.2 0.5 0.5 4.5 0.1 e 0.3 1.7 6.6 0.8 0.6 0.5 0.2 1 1.1 .. 0.8 0.1 e
0.7 0.2 0.3 2.7 0.1 e 0.2 0.9 2.8 0.4 0.4 0.4 0.2 0.3 0.6 .. 0.4 0.1 d
34.2 49.3 f .. 31.4 16.2 7.9 f 50.0 38.3 37.0 .. 65.3 .. 12.4 57.1 f 34.0 c 15.9 ..
56.5 .. 47.2 40.5 27.8 38.0 .. 40.8 54.0 .. 74.7 .. .. .. 46.5 c .. ..
18.6 5.0 72.3 39.4 23.1 57.9 59.5 39.0 44.9 38.0 45.8 .. 5.0 86.0 25.5 .. 57.6
27.9 .. .. 24.0 c .. 42.0 c 31.1 10.0 c
.. .. .. 2.8 c .. 4.7 5.4 6.3 c
.. .. .. .. .. .. 19.0 ..
.. .. .. .. .. 0.2 1.2 ..
.. .. .. .. .. 0.2 0.6 ..
.. 8.8 f .. 8.2 .. .. 7.3 ..
.. 22.6 .. 16.7 .. .. .. ..
.. .. .. .. .. 94.0 90.0 ..
.. 94.9 78.7 70.5
.. .. 40.3 39.8
.. .. 5.3 4.2
.. .. .. ..
.. .. .. ..
.. .. .. ..
.. .. .. ..
.. .. .. ..
.. .. 8.3 46.1
78.1 93.4 95.2 96.1 71.8 76.9 69.1 92.1 84.8
27.7 18.4 15.5 14.6 46.7 37.8 41.1 .. ..
.. 7.0 9.7 .. 2.5 4.6 3.8 .. ..
.. .. .. .. .. 200.8 .. .. ..
.. .. .. .. .. .. .. .. ..
.. .. .. .. .. .. .. .. ..
.. .. .. .. .. .. .. .. ..
.. .. .. .. .. .. .. .. ..
.. .. .. 11.9 .. 34.8 33.7 .. ..
Children living with HIV: Estimated number of children (ages 0–14) living with HIV. HIV prevalence, youth: Percentage of the population ages 15–24 who are living with HIV. Condoms use among young people with multiple partners: Proportion of young people (ages 15–24) who reported having had more than one sexual partner in the past 12 months and who used a condom the last
2011
time they had sex with any partner, expressed as a percentage of all young people with multiple partners. Pregnant women living with HIV not receiving treatment to prevent mother-to-child transmission: Proportion of pregnant women living with HIV who are not receiving antiretroviral medicines to prevent mother-to-child transmission, expressed as a percentage of all pregnant women living with HIV. MAIN DATA SOURCES Columns 1 and 6–13: UNICEF 2014. Columns 2 and 3: HDRO calculations based on data from UNICEF (2014). Columns 4 and 5: Inter-agency Group for Child Mortality Estimation 2013. Column 14: WHO 2013a.
TABLE 7 Health: children and youth | 187
TABLE
7