HUMAN DEVELOPMENT REPORT 2014 Sustaining Human Progress Reducing Vulnerabilities and Building Resilience
Population in multidimensional povertyc Multidimensional Poverty Indexb
Sierra Leone South Africa South Africa Suriname Suriname Tajikistan Tajikistan The former Yugoslav Republic of Macedonia The former Yugoslav Republic of Macedonia Togo Togo Uganda Uganda Zimbabwe Zimbabwe
Headcount
Year and surveya
Value
(%)
2008 D 2012 N 2008 N 2010 M 2006 M 2012 D 2005 M 2011 M 2005 M 2010 M 2006 M 2011 D 2006 D 2010/2011 D 2006 D
0.451 0.041 0.039 f 0.033 d 0.044 0.031 0.059 0.007 d 0.013 0.260 0.277 0.359 0.399 0.181 0.193
79.7 10.3 9.4 f 7.6 d 9.2 7.9 14.7 1.7 d 3.0 50.9 53.1 70.3 74.5 41.0 42.4
NOTES
e Missing indicators on nutrition.
a D indicates data from Demographic and Health Surveys, M indicates data from Multiple Indicator Cluster Surveys, and N indicates data from national surveys (see http://hdr.undp.org for the list of national surveys).
f Missing indicator on type of floor.
b Not all indicators were available for all countries, so caution should be used in cross-country comparisons. Where data were missing, indicator weights are adjusted to total 100%. c Based on revised definitions of deprivations in some indicators compared to the 2010 specificiations—outlined in Technical note 5 at http://hdr.undp.org. d Missing indicator on child mortality.
(thousands)
4,409 5,400 4,701 f 40 d 46 629 1,002 36 d 64 3,207 3,021 24,712 22,131 5,482 5,399
Intensity of deprivation
Population near multidimensional poverty
Population in severe poverty
(%)
(%)
(%)
56.6 39.6 41.5 f 43.1 d 47.4 39.0 39.8 38.4 d 42.2 51.2 52.2 51.1 53.6 44.1 45.4
12.5 17.1 21.4 f 4.7 d 6.3 23.4 18.6 2.4 d 7.1 20.3 20.3 20.6 18.2 24.9 22.8
51.7 1.3 1.4 f 2.0 d 3.6 1.2 2.3 0.1 d 0.7 26.4 28.8 33.3 41.5 12.2 15.7
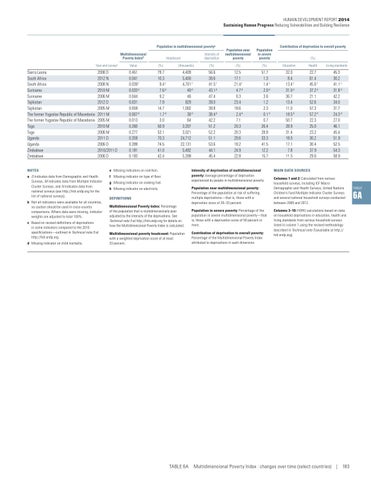
Intensity of deprivation of multidimensional poverty: Average percentage of deprivation experienced by people in multidimensional poverty.
g Missing indicator on cooking fuel. h Missing indicator on electricity. DEFINITIONS Multidimensional Poverty Index: Percentage of the population that is multidimensionally poor adjusted by the intensity of the deprivations. See Technical note 5 at http://hdr.undp.org for details on how the Multidimensional Poverty Index is calculated. Multidimensional poverty headcount: Population with a weighted deprivation score of at least 33 percent.
Population near multidimensional poverty: Percentage of the population at risk of suffering multiple deprivations—that is, those with a deprivation score of 20–33 percent. Population in severe poverty: Percentage of the population in severe multidimensional poverty—that is, those with a deprivation score of 50 percent or more. Contribution of deprivation to overall poverty: Percentage of the Multidimensional Poverty Index attributed to deprivations in each dimension.
Contribution of deprivation to overall poverty (%) Education
Health
Living standards
32.0 8.4 13.4 f 31.0 d 36.7 13.4 11.0 18.5 d 50.7 28.9 31.4 18.0 17.1 7.8 11.5
22.7 61.4 45.6 f 37.2 d 21.1 52.6 57.3 57.2 d 22.3 25.0 23.2 30.2 30.4 37.9 29.6
45.3 30.2 41.1 f 31.8 d 42.2 34.0 31.7 24.3 d 27.0 46.1 45.4 51.9 52.5 54.3 58.9
MAIN DATA SOURCES Columns 1 and 2: Calculated from various household surveys, including ICF Macro Demographic and Health Surveys, United Nations Children’s Fund Multiple Indicator Cluster Surveys and several national household surveys conducted between 2005 and 2012. Columns 3–10: HDRO calculations based on data on household deprivations in education, health and living standards from various household surveys listed in column 1 using the revised methodology described in Technical note 5 (available at http:// hdr.undp.org).
TABLE 6A Multidimensional Poverty Index : changes over time (select countries) | 183
TABLE
6A