TABLE
6A
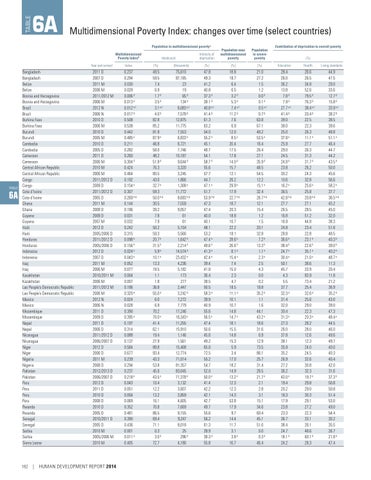
Multidimensional Poverty Index: changes over time (select countries) Population in multidimensional povertyc Multidimensional Poverty Indexb Year and surveya
TABLE
6A
Bangladesh Bangladesh Belize Belize Bosnia and Herzegovina Bosnia and Herzegovina Brazil Brazil Burkina Faso Burkina Faso Burundi Burundi Cambodia Cambodia Cameroon Cameroon Central African Republic Central African Republic Congo Congo Cote d’Ivoire Cote d’Ivoire Ghana Ghana Guyana Guyana Haiti Haiti Honduras Honduras Indonesia Indonesia Iraq Iraq Kazakhstan Kazakhstan Lao People’s Democratic Republic Lao People’s Democratic Republic Mexico Mexico Mozambique Mozambique Nepal Nepal Nicaragua Nicaragua Niger Niger Nigeria Nigeria Pakistan Pakistan Peru Peru Peru Peru Rwanda Rwanda Senegal Senegal Serbia Serbia Sierra Leone
182
2011 D 2007 D 2011 M 2006 M 2011/2012 M 2006 M 2012 N 2006 N 2010 D 2006 M 2010 D 2005 M 2010 D 2005 D 2011 D 2006 M 2010 M 2006 M 2011/2012 D 2009 D 2011/2012 D 2005 D 2011 M 2008 D 2009 D 2007 M 2012 D 2005/2006 D 2011/2012 D 2005/2006 D 2012 D 2007 D 2011 M 2006 M 2010/2011 M 2006 M 2011/2012 M 2006 M 2012 N 2006 N 2011 D 2009 D 2011 D 2006 D 2011/2012 D 2006/2007 D 2012 D 2006 D 2011 M 2008 D 2012/2013 D 2006/2007 D 2012 D 2011 D 2010 D 2008 D 2010 D 2005 D 2010/2011 D 2005 D 2010 M 2005/2006 M 2010 M
| HUMAN DEVELOPMENT REPORT 2014
Headcount
Value
(%)
0.237 0.294 0.030 0.028 0.006 d 0.013 d 0.012 e,f 0.017 g 0.508 0.538 0.442 0.485 e 0.211 0.282 0.260 0.304 d 0.424 0.464 0.192 0.154 e 0.307 0.269 e,g 0.144 0.186 0.031 0.032 0.242 0.315 0.098 h 0.156 h 0.024 e 0.043 e 0.052 0.077 0.004 0.007 0.186 0.320 d 0.024 0.028 0.390 0.395 e 0.197 0.314 0.088 0.137 0.584 0.677 0.239 0.294 0.237 0.218 e 0.043 0.051 0.056 0.069 0.352 0.481 0.390 0.436 0.001 0.011 d 0.405
49.5 59.5 7.4 6.9 1.7 d 3.5 d 3.1 e,f 4.0 g 82.8 85.2 81.8 87.9 e 46.8 58.0 48.2 51.8 d 76.3 80.5 43.0 32.7 e 59.3 50.0 e,g 30.5 39.2 7.8 7.9 50.2 59.3 20.7 h 31.5 h 5.9 e 10.1 e 13.3 18.5 1.1 1.8 36.8 55.0 d 6.0 6.9 70.2 70.0 e 41.4 62.1 19.4 27.9 89.8 93.4 43.3 53.8 45.6 43.5 e 10.4 12.2 13.2 16.1 70.8 86.5 69.4 71.1 0.3 3.0 d 72.7
(thousands)
75,610 87,185 23 19 65 d 134 d 6,083 e,f 7,578 g 12,875 11,775 7,553 6,833 e 6,721 7,746 10,187 9,644 d 3,320 3,245 1,866 1,308 e 11,772 8,693 e,g 7,559 9,057 61 61 5,104 5,566 1,642 h 2,214 h 14,574 e 23,432 e 4,236 5,182 173 277 2,447 3,242 d 7,272 7,779 17,246 16,343 e 11,255 15,910 1,146 1,561 15,408 12,774 71,014 81,357 83,045 71,378 e 3,132 3,607 3,859 4,605 7,669 8,155 9,247 8,018 25 296 d 4,180
Intensity of deprivation
Population near multidimensional poverty
Population in severe poverty
(%)
(%)
(%)
47.8 49.3 41.2 40.8 37.3 d 38.1 d 40.8 e,f 41.4 g 61.3 63.2 54.0 55.2 e 45.1 48.7 54.1 58.7 d 55.6 57.7 44.7 47.1 e 51.7 53.9 e,g 47.3 47.4 40.0 40.1 48.1 53.2 47.4 h 49.6 h 41.3 e 42.4 e 39.4 41.8 36.4 38.5 50.5 58.3 d 39.9 40.9 55.6 56.5 e 47.4 50.6 45.6 49.2 65.0 72.5 55.2 54.7 52.0 50.0 e 41.4 42.2 42.1 42.7 49.7 55.6 56.2 61.3 39.9 38.3 d 55.8
18.8 18.7 6.4 6.5 3.2 d 5.3 d 7.4 e,f 11.2 g 7.6 6.9 12.0 8.5 e 20.4 17.5 17.8 14.0 d 15.7 12.1 26.2 29.9 e 17.9 22.7 e,g 18.7 20.3 18.8 10.7 22.2 18.1 28.6 h 26.6 h 8.1 e 15.4 e 7.4 15.0 2.3 4.7 18.5 11.1 d 10.1 10.7 14.8 14.7 e 18.1 15.5 14.8 15.3 5.9 3.4 17.0 18.2 14.9 13.2 e 12.3 12.3 14.3 53.8 17.9 9.7 14.4 11.7 3.1 3.8 d 16.7
21.0 27.2 1.5 1.2 0.0 d 0.1 d 0.5 e,f 0.7 g 63.8 67.1 48.2 53.5 e 16.4 26.4 27.1 35.9 d 48.5 54.5 12.2 15.1 e 32.4 26.7 e,g 12.1 15.4 1.2 1.5 20.1 32.8 7.2 h 13.3 h 1.1 e 2.3 e 2.5 4.3 0.0 0.2 18.8 35.2 d 1.1 1.6 44.1 43.2 e 18.6 31.6 6.9 12.9 73.5 86.1 25.7 31.4 26.5 21.7 e 2.1 2.8 3.1 15.1 34.6 60.4 45.1 51.6 0.0 0.3 d 46.4
Contribution of deprivation to overall poverty (%) Education
28.4 26.0 36.2 13.8 7.8 d 7.9 d 27.7 e,f 41.4 g 39.0 38.0 25.0 37.8 e 25.9 29.0 24.5 24.8 d 23.8 30.2 10.6 16.2 e 36.5 42.8 e,g 27.7 26.5 16.8 16.9 24.8 28.8 36.6 h 38.4 h 24.7 e 30.4 e 50.1 45.7 4.3 5.5 37.7 32.3 d 31.4 32.0 30.4 31.3 e 27.3 26.0 37.8 38.1 35.9 35.2 26.9 27.2 36.2 43.0 e 19.4 20.2 18.3 17.9 23.8 23.3 36.7 38.4 24.7 18.1 d 24.2
Health
26.6 26.5 34.8 52.6 79.5 d 76.3 d 38.4 e,f 20.4 g 22.5 22.3 26.3 11.1 e 27.7 26.3 31.3 31.7 d 26.2 24.3 32.8 25.6 e 25.8 20.8 e,g 27.1 28.5 51.2 44.8 23.4 22.8 23.1 h 22.6 h 35.1 e 21.0 e 38.6 33.9 83.9 73.4 25.4 32.6 d 25.6 29.0 22.3 20.3 e 28.2 28.0 12.6 12.3 24.0 24.5 32.6 30.8 32.3 19.7 e 29.8 29.0 30.3 29.1 27.2 22.3 33.1 26.1 48.6 60.1 d 28.3
Living standards
44.9 47.5 29.0 33.6 12.7 d 15.8 d 33.9 e,f 38.2 g 38.5 39.6 48.8 51.1 e 46.4 44.7 44.2 43.5 d 50.0 45.6 56.6 58.2 e 37.7 36.5 e,g 45.2 45.0 32.0 38.3 51.8 48.5 40.3 h 39.0 h 40.2 e 48.7 e 11.3 20.4 11.8 21.2 36.9 35.2 d 43.0 39.0 47.3 48.4 e 44.5 46.0 49.6 49.7 40.0 40.3 40.4 42.0 31.6 37.3 e 50.8 50.8 51.4 53.0 49.0 54.4 30.2 35.5 26.7 21.8 d 47.4