HUMAN DEVELOPMENT REPORT 2014 Sustaining Human Progress Reducing Vulnerabilities and Building Resilience
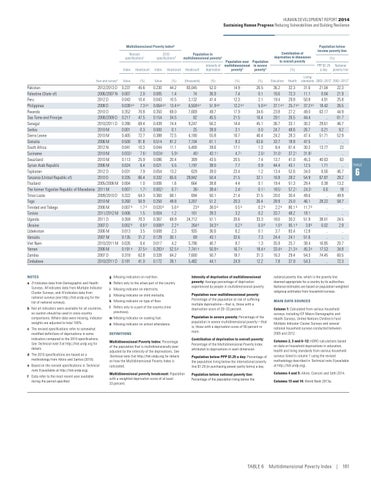
Multidimensional Poverty Indexb Revised specificationsc
Year and surveya
Pakistan Palestine (State of) Peru Philippines Rwanda Sao Tome and Principe Senegal Serbia Sierra Leone Somalia South Africa Suriname Swaziland Syrian Arab Republic Tajikistan Tanzania (United Republic of) Thailand The former Yugoslav Republic of Macedonia Timor-Leste Togo Trinidad and Tobago Tunisia Uganda Ukraine Uzbekistan Vanuatu Viet Nam Yemen Zambia Zimbabwe
2012/2013 D 2006/2007 N 2012 D 2008 D 2010 D 2008/2009 D 2010/2011 D 2010 M 2010 M 2006 M 2012 N 2010 M 2010 M 2006 M 2012 D 2010 D 2005/2006 M 2011 M 2009/2010 D 2010 M 2006 M 2011/2012 M 2011 D 2007 D 2006 M 2007 M 2010/2011 M 2006 M 2007 D 2010/2011 D
2010 specificationsd
Index
Headcount
Index
Headcount
Headcount
Intensity of deprivation
Value
(%)
Value
(%)
(thousands)
(%)
0.237 0.007 0.043 0.038 g,n 0.352 0.217 0.390 0.001 0.405 0.500 0.041 0.033 j 0.113 0.024 0.031 0.335 0.004 0.007 j 0.322 0.260 0.007 g 0.006 0.359 0.002 g 0.013 0.135 0.026 0.191 g 0.318 0.181
45.6 2.0 10.4 7.3 g,n 70.8 47.5 69.4 0.3 72.7 81.8 10.3 7.6 j 25.9 6.4 7.9 66.4 1.0 1.7 j 64.3 50.9 1.7 g 1.5 70.3 0.6 g 3.5 31.2 6.4 37.5 g 62.8 41.0
0.230 0.005 0.043 0.064 g,n 0.350 0.154 0.439 0.000 0.388 0.514 0.044 0.024 j 0.086 0.021 0.054 0.332 0.006 0.002 j 0.360 0.250 0.020 g 0.004 0.367 0.008 g 0.008 0.129 0.017 0.283 g 0.328 0.172
44.2 1.4 10.5 13.4 g,n 69.0 34.5 74.4 0.1 72.5 81.2 11.1 5.9 j 20.4 5.5 13.2 65.6 1.6 0.7 j 68.1 49.8 5.6 g 1.2 69.9 2.2 g 2.3 30.1 4.2 52.5 g 64.2 39.1
NOTES
g Missing indicators on nutrition.
a D indicates data from Demographic and Health Surveys, M indicates data from Multiple Indicator Cluster Surveys, and N indicates data from national surveys (see http://hdr.undp.org for the list of national surveys).
h Refers only to the urban part of the country.
b Not all indicators were available for all countries, so caution should be used in cross-country comparisons. Where data were missing, indicator weights are adjusted to total 100%.
l Refers only to a part of the country (nine provinces).
c The revised specifications refer to somewhat modified definitions of deprivations in some indicators compared to the 2010 specifications. See Technical note 5 at http://hdr.undp.org for details. d The 2010 specifications are based on a methodology from Alkire and Santos (2010). e Based on the revised specifications in Technical note 5 (available at http://hdr.undp.org). f Data refer to the most recent year available during the period specified.
Population in multidimensional povertye
i Missing indicator on electricity. j Missing indicator on child mortality. k Missing indicator on type of floor.
m Missing indicator on cooking fuel. n Missing indicator on school attendance. DEFINITIONS Multidimensional Poverty Index: Percentage of the population that is multidimensionally poor adjusted by the intensity of the deprivations. See Technical note 5 at http://hdr.undp.org for details on how the Multidimensional Poverty Index is calculated. Multidimensional poverty headcount: Population with a weighted deprivation score of at least 33 percent.
83,045 74 3,132 6,559 g,n 7,669 82 9,247 25 4,180 7,104 5,400 40 j 309 1,197 629 29,842 664 36 j 694 3,207 23 g 161 24,712 264 g 935 69 5,796 7,741 g 7,600 5,482
52.0 36.9 41.4 51.9 g,n 49.7 45.5 56.2 39.9 55.8 61.1 39.6 43.1 j 43.5 38.0 39.0 50.4 38.8 38.4 j 50.1 51.2 38.0 g 39.3 51.1 34.3 g 36.6 43.1 40.7 50.9 g 50.7 44.1
Population near Population multidimensional in severe povertye povertye (%)
(%)
14.9 7.4 12.3 12.2 g,n 17.9 21.5 14.4 3.1 16.7 8.3 17.1 4.7 j 20.5 7.7 23.4 21.5 4.4 2.4 j 21.4 20.3 0.5 g 3.2 20.6 0.2 g 6.2 32.6 8.7 16.7 g 18.7 24.9
26.5 0.1 2.1 5.0 g,n 34.6 16.4 45.1 0.0 46.4 63.6 1.3 2.0 j 7.4 0.9 1.2 32.1 0.1 0.1 j 31.5 26.4 0.2 g 0.2 33.3 0.0 g 0.1 7.3 1.3 18.4 g 31.3 12.2
Intensity of deprivation of multidimensional poverty: Average percentage of deprivation experienced by people in multidimensional poverty. Population near multidimensional poverty: Percentage of the population at risk of suffering multiple deprivations—that is, those with a deprivation score of 20–33 percent. Population in severe poverty: Percentage of the population in severe multidimensional poverty—that is, those with a deprivation score of 50 percent or more. Contribution of deprivation to overall poverty: Percentage of the Multidimensional Poverty Index attributed to deprivations in each dimension. Population below PPP $1.25 a day: Percentage of the population living below the international poverty line $1.25 (in purchasing power parity terms) a day. Population below national poverty line: Percentage of the population living below the
Contribution of deprivation in dimension to overall poverty (%) Education
36.2 16.6 19.4 37.1 g,n 23.8 29.1 36.7 24.7 24.2 33.7 8.4 31.0 j 13.7 44.4 13.4 16.9 19.4 18.5 j 20.0 28.9 2.2 g 33.7 18.0 1.0 g 3.7 24.4 35.9 33.4 g 16.3 7.8
Health
32.3 72.3 29.8 25.7 g,n 27.2 26.5 33.1 48.6 28.3 18.8 61.4 37.2 j 41.0 43.1 52.6 28.2 51.3 57.2 j 30.4 25.0 86.1 g 48.2 30.2 95.1 g 83.4 24.1 25.7 21.3 g 29.4 37.9
Population below income poverty line (%) PPP $1.25 National a day poverty line
Living standards 2002–2012f 2002–2012f
31.6 11.1 50.8 37.2 g,n 49.0 44.4 30.2 26.7 47.4 47.5 30.2 31.8 j 45.3 12.5 34.0 54.9 29.4 24.3 j 49.6 46.1 11.7 g 18.1 51.9 3.8 g 12.8 51.6 38.4 45.3 g 54.3 54.3
21.04 0.04 4.91 18.42 63.17 .. 29.61 0.21 51.71 .. 13.77 .. 40.63 1.71 6.56 67.87 0.38 0.6 .. 28.22 .. .. 38.01 0.02 .. .. 16.85 17.53 74.45 ..
22.3 21.9 25.8 26.5 44.9 61.7 46.7 9.2 52.9 .. 23 .. 63 .. 46.7 28.2 13.2 19 49.9 58.7 .. .. 24.5 2.9 .. .. 20.7 34.8 60.5 72.3
national poverty line, which is the poverty line deemed appropriate for a country by its authorities. National estimates are based on population-weighted subgroup estimates from household surveys. MAIN DATA SOURCES Column 1: Calculated from various household surveys, including ICF Macro Demographic and Health Surveys, United Nations Children’s Fund Multiple Indicator Cluster Surveys and several national household surveys conducted between 2005 and 2012. Columns 2, 3 and 6–12: HDRO calculations based on data on household deprivations in education, health and living standards from various household surveys listed in column 1 using the revised methodology described in Technical note 5 (available at http://hdr.undp.org). Columns 4 and 5: Alkire, Conconi and Seth 2014. Columns 13 and 14: World Bank 2013a.
TABLE 6 Multidimensional Poverty Index | 181
TABLE
6