TABLE
6
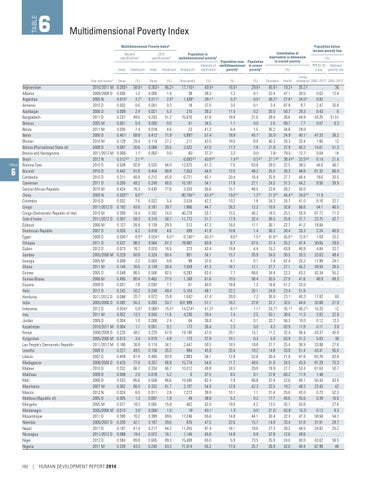
Multidimensional Poverty Index Multidimensional Poverty Indexb Revised specificationsc
Year and surveya
Afghanistan Albania Argentina Armenia Azerbaijan Bangladesh Belarus Belize Benin Bhutan Bolivia (Plurinational State of) Bosnia and Herzegovina Brazil TABLE Burkina Faso Burundi Cambodia Cameroon Central African Republic China Colombia Congo Congo (Democratic Republic of the) Cote d’Ivoire Djibouti Dominican Republic Egypt Ethiopia Gabon Gambia Georgia Ghana Guinea Guinea-Bissau Guyana Haiti Honduras India Indonesia Iraq Jordan Kazakhstan Kenya Kyrgyzstan Lao People’s Democratic Republic Lesotho Liberia Madagascar Malawi Maldives Mali Mauritania Mexico Moldova (Republic of) Mongolia Montenegro Mozambique Namibia Nepal Nicaragua Niger Nigeria
6
180
2010/2011 M 2008/2009 D 2005 N 2010 D 2006 D 2011 D 2005 M 2011 M 2006 D 2010 M 2008 D 2011/2012 M 2012 N 2010 D 2010 D 2010 D 2011 D 2010 M 2009 N 2010 D 2011/2012 D 2010 M 2011/2012 D 2006 M 2007 D 2008 D 2011 D 2012 D 2005/2006 M 2005 M 2011 M 2005 D 2006 M 2009 D 2012 D 2011/2012 D 2005/2006 D 2012 D 2011 M 2009 D 2010/2011 M 2008/2009 D 2005/2006 M 2011/2012 M 2009 D 2007 D 2008/2009 D 2010 D 2009 D 2006 D 2007 M 2012 N 2005 D 2005 M 2005/2006 M 2011 D 2006/2007 D 2011 D 2011/2012 D 2012 D 2011 M
| HUMAN DEVELOPMENT REPORT 2014
2010 specificationsd
Population in multidimensional povertye
Index
Headcount
Index
Headcount
Headcount
Intensity of deprivation
Value
(%)
Value
(%)
(thousands)
(%)
58.8 g 1.2 3.7 h 0.6 2.4 49.5 0.4 7.4 69.8 i 29.4 20.6 1.7 j 3.1 g,k 82.8 81.8 46.8 48.2 76.3 6.0 k,l 7.6 43.0 74.4 59.3 26.9 6.2 8.9 m 88.2 16.7 60.8 2.2 30.5 86.5 80.4 7.8 50.2 20.7 i 55.3 5.9 g 13.3 1.0 1.1 48.2 3.4 36.8 49.5 81.9 77.0 66.7 2.0 85.6 66.0 6.0 1.3 18.3 3.0 j 70.2 42.1 41.4 19.4 89.8 43.3
0.353 g 0.005 0.011 h 0.001 0.021 0.253 0.000 0.018 0.412 i 0.119 0.089 0.002 j
66.2 g 1.4 2.9 h 0.3 5.3 51.2 0.0 4.6 71.8 i 27.2 20.5 0.5 j
0.535 0.454 0.212 0.248 0.430 .. 0.022 0.181 0.392 0.310 0.139 0.018 0.024 m 0.564 0.070 0.324 0.003 0.139 0.506 0.462 0.030 0.248 0.072 i 0.283 0.066 g 0.045 0.008 0.001 0.229 0.019 0.174 0.156 0.485 0.357 0.334 0.018 0.558 0.352 0.011 0.007 0.065 0.006 j 0.389 0.187 0.217 0.072 0.605 0.240
84.0 80.8 45.9 46.0 77.6 .. 5.4 39.7 74.0 58.7 29.3 4.6 6.0 m 87.3 16.5 60.4 0.8 30.4 82.5 77.5 7.7 49.4 15.8 i 53.7 15.5 g 11.6 2.4 0.2 47.8 4.9 34.1 35.3 83.9 66.9 66.7 5.2 86.6 61.7 2.8 1.9 15.8 1.5 j 69.6 39.6 44.2 16.1 89.3 43.3
17,116 g 38 1,438 h 18 210 75,610 41 23 5,897 i 211 2,022 65 j 6,083 g,k 12,875 7,553 6,721 10,187 3,320 80,784 k,l 3,534 1,866 46,278 11,772 212 599 6,740 m 78,887 273 901 99 7,559 8,283 1,168 61 5,104 1,642 i 631,999 14,574 g 4,236 64 173 19,190 173 2,447 984 2,883 15,774 10,012 6 10,545 2,197 7,272 49 462 19 j 17,246 876 11,255 1,146 15,408 71,014
0.293 g 0.005 0.015 h 0.002 0.009 0.237 0.001 0.030 0.401 i 0.128 0.097 0.006 j 0.012 g,k 0.508 0.442 0.211 0.260 0.424 0.026 k,l 0.032 0.192 0.399 0.307 0.127 0.026 0.036 m 0.537 0.073 0.329 0.008 0.144 0.548 0.495 0.031 0.242 0.098 i 0.282 0.024 g 0.052 0.004 0.004 0.226 0.013 0.186 0.227 0.459 0.420 0.332 0.008 0.533 0.362 0.024 0.005 0.077 0.012 j 0.390 0.200 0.197 0.088 0.584 0.239
49.9 g 38.3 39.1 h 37.0 38.2 47.8 34.5 41.2 57.4 i 43.5 47.0 37.3 j 40.8 g,k 61.3 54.0 45.1 54.1 55.6 43.4 k,l 42.2 44.7 53.7 51.7 47.3 41.9 40.3 m 60.9 43.4 54.1 37.6 47.3 63.4 61.6 40.0 48.1 47.4 i 51.1 41.3 g 39.4 36.8 36.4 47.0 37.9 50.5 45.9 56.1 54.6 49.8 37.5 62.4 54.9 39.9 38.8 42.0 40.1 j 55.6 47.5 47.4 45.6 65.0 55.2
Population near Population multidimensional in severe povertye povertye (%)
16.0 g 7.2 5.2 h 3.0 11.5 18.8 1.1 6.4 18.8 i 18.0 17.3 3.2 j 7.4 g,k 7.6 12.0 20.4 17.8 15.7 19.0 k,l 10.2 26.2 15.5 17.9 16.0 10.8 8.6 m 6.7 19.9 15.7 4.1 18.7 7.7 10.5 18.8 22.2 28.6 i 18.2 8.1 g 7.4 4.1 2.3 29.1 10.1 18.5 20.4 12.9 11.7 24.5 8.5 7.8 12.8 10.1 5.2 19.0 1.3 j 14.8 22.6 18.1 14.8 5.9 17.0
(%)
29.8 g 0.1 0.5 h 0.1 0.2 21.0 0.0 1.5 45.7 i 8.8 7.8 0.0 j 0.5 g,k 63.8 48.2 16.4 27.1 48.5 1.3 k,l 1.8 12.2 46.2 32.4 11.1 1.4 1.5 m 67.0 4.4 35.9 0.1 12.1 68.6 58.4 1.2 20.1 7.2 i 27.8 1.1 g 2.5 0.1 0.0 15.7 0.3 18.8 18.2 52.8 48.0 29.8 0.1 66.8 42.3 1.1 0.2 4.2 0.5 j 44.1 15.7 18.6 6.9 73.5 25.7
Contribution of deprivation in dimension to overall poverty (%) Education
45.6 g 22.4 38.2 h 3.4 20.0 28.4 2.6 36.2 35.0 i 40.3 21.9 7.8 j 27.7 g,k 39.0 25.0 25.9 24.5 23.8 21.0 k,l 34.3 10.6 18.5 36.5 36.1 36.2 41.8 m 27.4 15.2 34.0 7.4 27.7 34.4 30.5 16.8 24.8 36.6 i 22.7 24.7 g 50.1 33.7 4.3 11.2 5.0 37.7 14.8 30.4 31.6 18.9 27.8 37.4 33.5 31.4 17.7 13.5 21.0 j 30.4 14.8 27.3 37.8 35.9 26.9
Health
19.2 g 47.1 27.8 h 87.8 50.7 26.6 89.7 34.8 24.9 i 26.3 27.9 79.5 j 38.4 g,k 22.5 26.3 27.7 31.3 26.2 44.4 k,l 24.7 32.8 25.5 25.8 22.7 30.4 45.6 m 25.2 43.8 30.5 67.4 27.1 22.3 27.9 51.2 23.4 23.1 i 32.5 35.1 g 38.6 56.3 83.9 32.4 63.9 25.4 33.8 21.8 24.5 27.7 60.2 22.6 18.2 25.6 46.6 35.7 63.8 j 22.3 33.4 28.2 12.6 24.0 32.6
Population below income poverty line (%) PPP $1.25 National a day poverty line
Living standards 2002–2012f 2002–2012f
35.2 g 30.5 34.0 h 8.7 29.3 44.9 7.7 29.0 40.1 i 33.4 50.2 12.7 j 33.9 g,k 38.5 48.8 46.4 44.2 50.0 34.6 k,l 41.0 56.6 55.9 37.7 41.2 33.3 12.6 m 47.4 40.9 35.5 25.2 45.2 43.3 41.6 32.0 51.8 40.3 i 44.8 40.2 g 11.3 10.0 11.8 56.4 31.2 36.9 51.4 47.8 43.9 53.4 11.9 40.1 48.3 43.0 35.6 50.8 15.3 j 47.3 51.8 44.5 49.6 40.0 40.4
.. 0.62 0.92 2.47 0.43 43.25 0.07 .. 47.33 1.66 15.61 0.04 6.14 44.6 81.32 18.6 9.56 .. 11.8 8.16 54.1 87.72 23.75 18.84 2.24 1.69 30.65 4.84 33.63 17.99 28.59 43.34 48.9 .. .. 17.92 32.68 16.20 2.82 0.12 0.11 43.37 5.03 33.88 43.41 83.76 81.29 61.64 1.48 50.43 23.43 0.72 0.39 .. 0.12 59.58 31.91 24.82 .. 43.62 67.98
36 12.4 .. 35.8 6 31.51 6.3 .. 36.2 12 51.3 14 21.4 46.7 66.9 20.5 39.9 .. .. 32.7 46.5 71.3 42.7 .. 40.9 25.2 29.6 32.7 48.4 24.7 28.5 55.2 69.3 .. .. 60 21.9 12 22.9 13.3 3.8 45.9 38 27.6 56.6 63.8 75.3 50.7 .. 43.6 42 52.3 16.6 27.4 9.3 54.7 28.7 25.2 .. 59.5 46