HUMAN DEVELOPMENT REPORT 2014 Sustaining Human Progress Reducing Vulnerabilities and Building Resilience
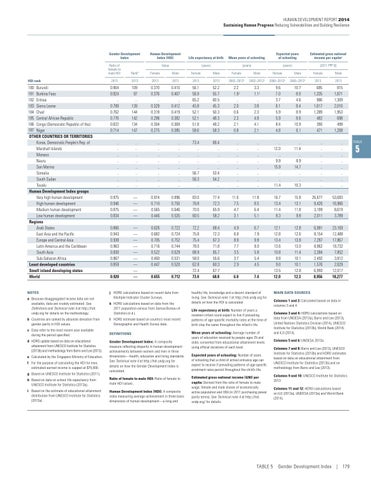
Gender Development Index
Human Development Index (HDI)
Ratio of female to male HDI
Rankb
Female
Male
Female
Male
Female
Male
Female
Male
Female
Male
HDI rank
2013
2013
2013
2013
2013
2013
2002–2012c
2002–2012c
2000–2012c
2000–2012c
2013
2013
180 Burundi 181 Burkina Faso 182 Eritrea 183 Sierra Leone 184 Chad 185 Central African Republic 186 Congo (Democratic Republic of the) 187 Niger OTHER COUNTRIES OR TERRITORIES Korea, Democratic People’s Rep. of Marshall Islands Monaco Nauru San Marino Somalia South Sudan Tuvalu Human Development Index groups Very high human development High human development Medium human development Low human development Regions Arab States East Asia and the Pacific Europe and Central Asia Latin America and the Caribbean South Asia Sub-Saharan Africa Least developed countries Small island developing states World
0.904 0.924 .. 0.799 0.762 0.776 0.822 0.714
109 97 .. 139 144 142 134 147
0.370 0.376 .. 0.329 0.319 0.296 0.304 0.275
0.410 0.407 .. 0.412 0.419 0.382 0.369 0.385
56.1 56.9 65.2 45.8 52.1 52.1 51.8 58.6
52.2 55.7 60.5 45.3 50.3 48.3 48.2 58.3
2.2 1.9 j .. 2.0 0.6 2.3 2.1 0.8
3.3 1.1 j .. 3.8 2.3 4.9 4.1 2.1
9.6 7.0 3.7 6.1 5.9 5.9 8.4 4.8
10.7 8.0 4.6 8.4 8.9 8.6 10.9 6.1
685 1,335 986 1,617 1,289 482 390 471
815 1,871 1,309 2,016 1,953 698 499 1,268
.. .. .. .. .. .. .. ..
.. .. .. .. .. .. .. ..
.. .. .. .. .. .. .. ..
.. .. .. .. .. .. .. ..
73.4 .. .. .. .. 56.7 56.3 ..
66.4 .. .. .. .. 53.4 54.2 ..
.. .. .. .. .. .. .. ..
.. .. .. .. .. .. .. ..
.. 12.0 .. 9.9 15.9 .. .. 11.4
.. 11.4 .. 8.9 14.7 .. .. 10.3
.. .. .. .. .. .. .. ..
.. .. .. .. .. .. .. ..
0.975 0.946 0.875 0.834
— — — —
0.874 0.710 0.565 0.446
0.896 0.750 0.646 0.535
83.0 76.8 70.0 60.5
77.4 72.3 65.9 58.2
11.6 7.5 4.7 3.1
11.8 8.5 6.4 5.1
16.7 13.4 11.4 8.3
15.8 13.1 11.8 9.8
26,677 9,426 3,199 2,011
53,683 16,966 8,619 3,789
0.866 0.943 0.938 0.963 0.830 0.867 0.859 .. 0.920
— — — — — — — — —
0.626 0.682 0.705 0.716 0.522 0.460 0.447 .. 0.655
0.722 0.724 0.752 0.744 0.629 0.531 0.520 .. 0.712
72.2 75.8 75.4 78.0 68.9 58.0 62.8 72.4 73.0
68.4 72.3 67.3 71.8 65.7 55.6 60.3 67.7 68.8
4.9 6.8 8.8 7.7 3.5 3.7 2.9 .. 6.0
6.7 7.9 9.8 8.0 5.8 5.4 4.5 .. 7.4
12.1 12.8 13.4 13.6 10.8 8.8 9.0 13.5 12.0
12.8 12.6 13.8 13.0 11.4 10.1 10.1 12.8 12.3
6,991 8,154 7,287 8,962 2,384 2,492 1,576 6,993 8,956
23,169 12,488 17,867 18,732 7,852 3,812 2,629 12,017 18,277
NOTES
j HDRO calculations based on recent data from Multiple Indicator Cluster Surveys.
a Because disaggregated income data are not available, data are crudely estimated. See Definitions and Technical note 4 at http://hdr. undp.org for details on the methodology.
Value
k HDRO calculations based on data from the 2011 population census from Samoa Bureau of Statistics (n.d.). l HDRO estimate based on country’s most recent Demographic and Health Survey data.
c Data refer to the most recent year available during the period specified.
DEFINITIONS
e Calculated by the Singapore Ministry of Education. f For the purpose of calculating the HDI for men, estimated earned income is capped at $75,000. g Based on UNESCO Institute for Statistics (2011).
Mean years of schooling
(years)
b Countries are ranked by absolute deviation from gender parity in HDI values.
d HDRO update based on data on educational attainment from UNESCO Institute for Statistics (2013b) and methodology from Barro and Lee (2013).
Life expectancy at birth
Gender Development Index: A composite measure reflecting disparity in human development achievements between women and men in three dimensions—health, education and living standards. See Technical note 4 at http://hdr.undp.org for details on how the Gender Development Index is calculated.
h Based on data on school life expectancy from UNESCO Institute for Statistics (2013a).
Ratio of female to male HDI: Ratio of female to male HDI values.
i Based on the estimate of educational attainment distribution from UNESCO Institute for Statistics (2013a) .
Human Development Index (HDI): A composite index measuring average achievement in three basic dimensions of human development—a long and
Expected years of schooling
(years)
Estimated gross national income per capitaa
(years)
healthy life, knowledge and a decent standard of living. See Technical note 1 at http://hdr.undp.org for details on how the HDI is calculated Life expectancy at birth: Number of years a newborn infant could expect to live if prevailing patterns of age-specific mortality rates at the time of birth stay the same throughout the infant’s life. Mean years of schooling: Average number of years of education received by people ages 25 and older, converted from educational attainment levels using official durations of each level. Expected years of schooling: Number of years of schooling that a child of school entrance age can expect to receive if prevailing patterns of age-specific enrolment rates persist throughout the child’s life. Estimated gross national income (GNI) per capita: Derived from the ratio of female to male wage, female and male shares of economically active population and GNI (in 2011 purchasing power parity terms). See Technical note 4 at http://hdr. undp.org/ for details.
(2011 PPP $)
MAIN DATA SOURCES Columns 1 and 2: Calculated based on data in columns 3 and 4. Columns 3 and 4: HDRO calculations based on data from UNDESA (2013a), Barro and Lee (2013), United Nations Statistics Division (2014), UNESCO Institute for Statistics (2013b), World Bank (2014) and ILO (2014). Columns 5 and 6: UNDESA 2013a. Columns 7 and 8: Barro and Lee (2013), UNESCO Institute for Statistics (2013b) and HDRO estimates based on data on educational attainment from UNESCO Institute for Statistics (2013b) and on methodology from Barro and Lee (2013). Columns 9 and 10: UNESCO Institute for Statistics 2013. Columns 11 and 12: HDRO calculations based on ILO (2013a), UNDESA (2013a) and World Bank (2014).
TABLE 5 Gender Development Index | 179
TABLE
5