HUMAN DEVELOPMENT REPORT 2014 Sustaining Human Progress Reducing Vulnerabilities and Building Resilience
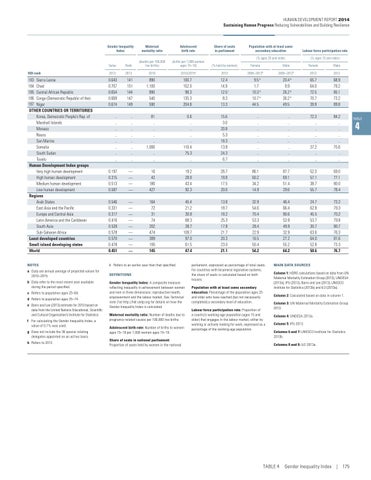
Gender Inequality Index
Maternal mortality ratio
Adolescent birth rate
Share of seats in parliament
Population with at least some secondary education
Labour force participation rate
(% ages 25 and older)
(% ages 15 and older)
Value
Rank
(deaths per 100,000 live births)
(births per 1,000 women ages 15–19)
(% held by women)
Female
Male
Female
Male
HDI rank
2013
2013
2010
2010/2015a
2013
2005–2012b
2005–2012b
2012
2012
183 Sierra Leone 184 Chad 185 Central African Republic 186 Congo (Democratic Republic of the) 187 Niger OTHER COUNTRIES OR TERRITORIES Korea, Democratic People’s Rep. of Marshall Islands Monaco Nauru San Marino Somalia South Sudan Tuvalu Human Development Index groups Very high human development High human development Medium human development Low human development Regions Arab States East Asia and the Pacific Europe and Central Asia Latin America and the Caribbean South Asia Sub-Saharan Africa Least developed countries Small island developing states World
0.643 0.707 0.654 0.669 0.674
141 151 144 147 149
890 1,100 890 540 590
100.7 152.0 98.3 135.3 204.8
12.4 14.9 12.5 i 8.3 13.3
9.5 e 1.7 10.3 e 10.7 e 44.5
20.4 e 9.9 26.2 e 36.2 e 49.5
65.7 64.0 72.5 70.7 39.9
68.9 79.2 85.1 73.2 89.8
.. .. .. .. .. .. .. ..
.. .. .. .. .. .. .. ..
81 .. .. .. .. 1,000 .. ..
0.6 .. .. .. .. 110.4 75.3 ..
15.6 3.0 20.8 5.3 18.3 13.8 24.3 6.7
.. .. .. .. .. .. .. ..
.. .. .. .. .. .. .. ..
72.3 .. .. .. .. 37.2 .. ..
84.2 .. .. .. .. 75.6 .. ..
0.197 0.315 0.513 0.587
— — — —
16 42 186 427
19.2 28.8 43.4 92.3
26.7 18.8 17.5 20.0
86.1 60.2 34.2 14.9
87.7 69.1 51.4 29.6
52.3 57.1 38.7 55.7
69.0 77.1 80.0 78.4
0.546 0.331 0.317 0.416 0.539 0.578 0.570 0.478 0.451
— — — — — — — — —
164 72 31 74 202 474 389 195 145
45.4 21.2 30.8 68.3 38.7 109.7 97.0 61.5 47.4
13.8 18.7 18.2 25.3 17.8 21.7 20.3 23.0 21.1
32.9 54.6 70.4 53.3 28.4 22.9 16.5 50.4 54.2
46.4 66.4 80.6 53.9 49.9 32.9 27.2 55.2 64.2
24.7 62.8 45.5 53.7 30.7 63.6 64.0 52.8 50.6
73.2 79.3 70.2 79.8 80.7 76.3 81.6 73.3 76.7
NOTES
i Refers to an earlier year than that specified.
a Data are annual average of projected values for 2010–2015.
DEFINITIONS
b Data refer to the most recent year available during the period specified. c Refers to population ages 25–64. d Refers to population ages 25–74. e Barro and Lee (2013) estimate for 2010 based on data from the United Nations Educational, Scientific and Cultural Organization’s Institute for Statistics. f For calculating the Gender Inequality Index, a value of 0.1% was used. g Does not include the 36 special rotating delegates appointed on an ad hoc basis. h Refers to 2012.
Gender Inequality Index: A composite measure reflecting inequality in achievement between women and men in three dimensions: reproductive health, empowerment and the labour market. See Technical note 3 at http://hdr.undp.org for details on how the Gender Inequality Index is calculated. Maternal mortality ratio: Number of deaths due to pregnancy-related causes per 100,000 live births. Adolescent birth rate: Number of births to women ages 15–19 per 1,000 women ages 15–19. Share of seats in national parliament: Proportion of seats held by women in the national
parliament, expressed as percentage of total seats. For countries with bicameral legislative systems, the share of seats is calculated based on both houses. Population with at least some secondary education: Percentage of the population ages 25 and older who have reached (but not necessarily completed) a secondary level of education.
MAIN DATA SOURCES Column 1: HDRO calculations based on data from UN Maternal Mortality Estimation Group (2013), UNDESA (2013a), IPU (2013), Barro and Lee (2013), UNESCO Institute for Statistics (2013b) and ILO (2013a). Column 2: Calculated based on data in column 1.
Labour force participation rate: Proportion of a country’s working-age population (ages 15 and older) that engages in the labour market, either by working or actively looking for work, expressed as a percentage of the working-age population.
Column 3: UN Maternal Mortality Estimation Group 2013. Column 4: UNDESA 2013a. Column 5: IPU 2013. Columns 6 and 7: UNESCO Institute for Statistics 2013b. Columns 8 and 9: ILO 2013a.
TABLE 4 Gender Inequality Index | 175
TABLE
4