TABLE
4
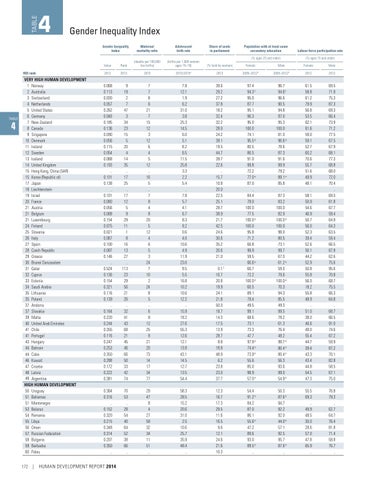
Gender Inequality Index Gender Inequality Index
HDI rank
TABLE
4
VERY HIGH HUMAN DEVELOPMENT 1 Norway 2 Australia 3 Switzerland 4 Netherlands 5 United States 6 Germany 7 New Zealand 8 Canada 9 Singapore 10 Denmark 11 Ireland 12 Sweden 13 Iceland 14 United Kingdom 15 Hong Kong, China (SAR) 15 Korea (Republic of) 17 Japan 18 Liechtenstein 19 Israel 20 France 21 Austria 21 Belgium 21 Luxembourg 24 Finland 25 Slovenia 26 Italy 27 Spain 28 Czech Republic 29 Greece 30 Brunei Darussalam 31 Qatar 32 Cyprus 33 Estonia 34 Saudi Arabia 35 Lithuania 35 Poland 37 Andorra 37 Slovakia 39 Malta 40 United Arab Emirates 41 Chile 41 Portugal 43 Hungary 44 Bahrain 44 Cuba 46 Kuwait 47 Croatia 48 Latvia 49 Argentina HIGH HUMAN DEVELOPMENT 50 Uruguay 51 Bahamas 51 Montenegro 53 Belarus 54 Romania 55 Libya 56 Oman 57 Russian Federation 58 Bulgaria 59 Barbados 60 Palau
172
Maternal mortality ratio
Adolescent birth rate
Share of seats in parliament
Population with at least some secondary education (% ages 25 and older)
Labour force participation rate (% ages 15 and older)
Value
Rank
(deaths per 100,000 live births)
(births per 1,000 women ages 15–19)
(% held by women)
Female
Male
Female
Male
2013
2013
2010
2010/2015a
2013
2005–2012b
2005–2012b
2012
2012
0.068 0.113 0.030 0.057 0.262 0.046 0.185 0.136 0.090 0.056 0.115 0.054 0.088 0.193 .. 0.101 0.138 .. 0.101 0.080 0.056 0.068 0.154 0.075 0.021 0.067 0.100 0.087 0.146 .. 0.524 0.136 0.154 0.321 0.116 0.139 .. 0.164 0.220 0.244 0.355 0.116 0.247 0.253 0.350 0.288 0.172 0.222 0.381
9 19 2 7 47 3 34 23 15 5 20 4 14 35 .. 17 25 .. 17 12 5 9 29 11 1 8 16 13 27 .. 113 23 29 56 21 26 .. 32 41 43 68 21 45 46 66 50 33 42 74
7 7 8 6 21 7 15 12 3 12 6 4 5 12 .. 16 5 .. 7 8 4 8 20 5 12 4 6 5 3 24 7 10 2 24 8 5 .. 6 8 12 25 8 21 20 73 14 17 34 77
7.8 12.1 1.9 6.2 31.0 3.8 25.3 14.5 6.0 5.1 8.2 6.5 11.5 25.8 3.3 2.2 5.4 .. 7.8 5.7 4.1 6.7 8.3 9.2 0.6 4.0 10.6 4.9 11.9 23.0 9.5 5.5 16.8 10.2 10.6 12.2 .. 15.9 18.2 27.6 55.3 12.6 12.1 13.8 43.1 14.5 12.7 13.5 54.4
39.6 29.2 27.2 37.8 18.2 32.4 32.2 28.0 24.2 39.1 19.5 44.7 39.7 22.6 .. 15.7 10.8 20.0 22.5 25.1 28.7 38.9 21.7 42.5 24.6 30.6 35.2 20.6 21.0 .. 0.1 f 10.7 20.8 19.9 24.1 21.8 50.0 18.7 14.3 17.5 13.9 28.7 8.8 18.8 48.9 6.2 23.8 23.0 37.7
97.4 94.3 c 95.0 87.7 95.1 96.3 95.0 100.0 74.1 95.5 d 80.5 86.5 91.0 99.8 72.2 77.0 e 87.0 .. 84.4 78.0 100.0 77.5 100.0 d 100.0 95.8 71.2 66.8 99.9 59.5 66.6 e 66.7 72.2 100.0 d 60.5 89.1 79.4 49.5 99.1 68.6 73.1 73.3 47.7 97.9 d 74.4 e 73.9 e 55.6 85.0 98.9 57.0 e
96.7 94.6 c 96.6 90.5 94.8 97.0 95.3 100.0 81.0 96.6 d 78.6 87.3 91.6 99.9 79.2 89.1 e 85.8 .. 87.3 83.2 100.0 82.9 100.0 d 100.0 98.0 80.5 73.1 99.7 67.0 61.2 e 59.0 79.6 100.0 d 70.3 94.3 85.5 49.3 99.5 78.2 61.3 76.4 48.2 98.7 d 80.4 e 80.4 e 56.3 93.6 99.0 54.9 e
61.5 58.8 61.2 79.9 56.8 53.5 62.1 61.6 59.0 59.1 52.7 60.2 70.6 55.7 51.6 49.9 48.1 .. 58.1 50.9 54.6 46.9 50.7 56.0 52.3 39.4 52.6 50.1 44.2 52.9 50.8 55.8 56.0 18.2 55.8 48.9 .. 51.0 38.0 46.6 49.0 55.4 44.7 39.4 43.3 43.4 44.8 54.5 47.3
69.5 71.9 75.3 87.3 69.3 66.4 73.9 71.2 77.5 67.5 67.9 68.1 77.3 68.8 68.0 72.0 70.4 .. 69.5 61.8 67.7 59.4 64.9 64.3 63.5 59.4 66.5 67.8 62.6 75.6 95.6 70.8 68.7 75.5 66.3 64.8 .. 68.7 66.5 91.0 74.6 67.2 59.9 87.2 70.1 82.8 58.5 67.1 75.0
0.364 0.316 .. 0.152 0.320 0.215 0.348 0.314 0.207 0.350 ..
70 53 .. 28 54 40 64 52 38 66 ..
29 47 8 4 27 58 32 34 11 51 ..
58.3 28.5 15.2 20.6 31.0 2.5 10.6 25.7 35.9 48.4 ..
12.3 16.7 17.3 29.5 11.6 16.5 9.6 12.1 24.6 21.6 10.3
54.4 91.2 e 84.2 87.0 86.1 55.6 e 47.2 89.6 93.0 89.5 e ..
50.3 87.6 e 94.7 92.2 92.0 44.0 e 57.1 92.5 95.7 87.6 e ..
55.5 69.3 .. 49.9 48.5 30.0 28.6 57.0 47.8 65.9 ..
76.8 79.3 .. 62.7 64.7 76.4 81.8 71.4 58.8 76.7 ..
| HUMAN DEVELOPMENT REPORT 2014