HUMAN DEVELOPMENT REPORT 2014 Sustaining Human Progress Reducing Vulnerabilities and Building Resilience
Human Development Index (HDI)
HDI rank
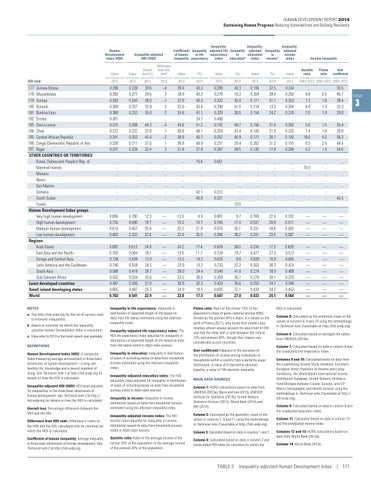
177 Guinea-Bissau 178 Mozambique 179 Guinea 180 Burundi 181 Burkina Faso 182 Eritrea 183 Sierra Leone 184 Chad 185 Central African Republic 186 Congo (Democratic Republic of the) 187 Niger OTHER COUNTRIES OR TERRITORIES Korea, Democratic People’s Rep. of Marshall Islands Monaco Nauru San Marino Somalia South Sudan Tuvalu Human Development Index groups Very high human development High human development Medium human development Low human development Regions Arab States East Asia and the Pacific Europe and Central Asia Latin America and the Caribbean South Asia Sub-Saharan Africa Least developed countries Small island developing states World NOTES a See http://hdr.undp.org for the list of surveys used to estimate inequalities. b Based on countries for which the Inequalityadjusted Human Development Index is calculated. c Data refer to 2013 or the most recent year available. DEFINITIONS Human Development Index (HDI): A composite index measuring average achievement in three basic dimensions of human development—a long and healthy life, knowledge and a decent standard of living. See Technical note 1 at http://hdr.undp.org for details on how the HDI is calculated. Inequality-adjusted HDI (IHDI): HDI value adjusted for inequalities in the three basic dimensions of human development. See Technical note 2 at http:// hdr.undp.org for details on how the IHDI is calculated. Overall loss: Percentage difference between the IHDI and the HDI.
InequalityInequalityInequalityCoefficient Inequality adjusted life Inequality adjusted Inequality adjusted expectancy education income of human in life in in index index inequality expectancy educationa index incomea
Inequality-adjusted HDI (IHDI)
Income inequality
Value
Value
Overall loss (%)
Difference from HDI rankb
2013
2013
2013
2013
2013
2013
2013
2013c
2013
2013c
2013
0.396 0.393 0.392 0.389 0.388 0.381 0.374 0.372 0.341 0.338 0.337
0.239 0.277 0.243 0.257 0.252 .. 0.208 0.232 0.203 0.211 0.228
39.6 29.5 38.0 33.9 35.0 .. 44.3 37.8 40.4 37.6 32.4
–4 2 –1 2 2 .. –3 1 –2 1 3
39.4 28.9 37.8 32.6 34.6 .. 43.6 36.8 39.9 36.8 31.8
45.3 40.2 40.3 43.6 41.1 24.7 51.2 46.1 45.7 49.9 37.9
0.289 0.278 0.332 0.296 0.329 0.496 0.192 0.259 0.252 0.231 0.367
40.3 18.2 42.0 41.0 38.5 .. 48.7 43.4 45.9 29.4 39.5
0.194 0.304 0.171 0.218 0.154 .. 0.156 0.145 0.172 0.262 0.120
32.5 28.4 31.1 13.2 24.2 .. 31.0 21.0 28.1 31.2 17.9
0.244 0.250 0.253 0.264 0.318 .. 0.302 0.332 0.192 0.155 0.269
.. 9.8 7.3 4.8 7.0 .. 5.6 7.4 18.0 9.3 5.3
.. 2.5 1.8 1.3 1.9 .. 1.5 1.8 4.5 2.4 1.4
35.5 45.7 39.4 33.3 39.8 .. 35.4 39.8 56.3 44.4 34.6
.. .. .. .. .. .. .. ..
.. .. .. .. .. .. .. ..
.. .. .. .. .. .. .. ..
.. .. .. .. .. .. .. ..
.. .. .. .. .. .. .. ..
15.4 .. .. .. .. 42.1 40.8 ..
0.651 .. .. .. .. 0.312 0.321 ..
.. .. .. .. .. .. .. 10.5
.. .. .. .. .. .. .. ..
.. .. .. .. .. .. .. ..
.. .. .. .. .. .. .. ..
.. 70.0 .. .. .. .. .. ..
.. .. .. .. .. .. .. ..
.. .. .. .. .. .. 45.5 ..
0.890 0.735 0.614 0.493
0.780 0.590 0.457 0.332
12.3 19.7 25.6 32.6
— — — —
12.0 19.3 25.2 32.4
4.9 10.7 21.9 35.0
0.881 0.749 0.575 0.394
8.7 17.4 35.1 38.2
0.769 0.531 0.331 0.241
22.4 29.9 18.6 23.9
0.702 0.517 0.502 0.387
— — — —
— — — —
— — — —
0.682 0.703 0.738 0.740 0.588 0.502 0.487 0.665 0.702
0.512 0.564 0.639 0.559 0.419 0.334 0.336 0.497 0.541
24.9 19.7 13.3 24.5 28.7 33.6 31.0 25.3 22.9
— — — — — — — — —
24.2 19.5 13.2 23.9 28.0 33.5 30.9 24.9 22.8
17.4 11.7 14.2 13.2 24.4 36.6 32.3 18.5 17.3
0.639 0.734 0.676 0.733 0.549 0.359 0.433 0.626 0.647
38.0 19.7 8.6 22.2 41.6 35.7 35.6 22.1 27.0
0.334 0.477 0.639 0.502 0.274 0.276 0.253 0.433 0.433
17.3 27.0 16.9 36.3 18.0 28.1 24.7 34.2 24.1
0.629 0.513 0.605 0.474 0.489 0.375 0.348 0.452 0.564
— — — — — — — — —
— — — — — — — — —
— — — — — — — — —
Value
(%)
Value
(%)
Value
(%)
Inequality in life expectancy: Inequality in distribution of expected length of life based on data from life tables estimated using the Atkinson inequality index. Inequality-adjusted life expectancy index: The HDI life expectancy index adjusted for inequality in distribution of expected length of life based on data from life tables listed in Main data sources. Inequality in education: Inequality in distribution of years of schooling based on data from household surveys estimated using the Atkinson inequality index. Inequality-adjusted education index: The HDI education index adjusted for inequality in distribution of years of schooling based on data from household surveys listed in Main data sources. Inequality in income: Inequality in income distribution based on data from household surveys estimated using the Atkinson inequality index.
Palma ratio: Ratio of the richest 10% of the population’s share of gross national income (GNI) divided by the poorest 40%’s share. It is based on the work of Palma (2011), who found that middle class incomes almost always account for about half of GNI and that the other half is split between the richest 10% and poorest 40%, though their shares vary considerably across countries. Gini coefficient: Measure of the deviation of the distribution of income among individuals or households within a country from a perfectly equal distribution. A value of 0 represents absolute equality, a value of 100 absolute inequality. MAIN DATA SOURCES Column 1: HDRO calculations based on data from UNDESA (2013a), Barro and Lee (2013), UNESCO Institute for Statistics (2013b), United Nations Statistics Division (2014), World Bank (2014) and IMF (2014).
Difference from HDI rank: Difference in ranks on the IHDI and the HDI, calculated only for countries for which the IHDI is calculated.
Inequality-adjusted income index: The HDI income index adjusted for inequality in income distribution based on data from household surveys listed in Main data sources.
Column 2: Calculated as the geometric mean of the values in columns 7, 9 and 11 using the methodology in Technical note 2 (available at http://hdr.undp.org).
Coefficient of human inequality: Average inequality in three basic dimensions of human development. See Technical note 2 at http://hdr.undp.org.
Quintile ratio: Ratio of the average income of the richest 20% of the population to the average income of the poorest 20% of the population.
Column 4: Calculated based on data in column 2 and recalculated HDI ranks for countries for which the
Column 3: Calculated based on data in columns 1 and 2.
Value
Quintile ratio
Palma ratio
Gini coefficient
2003–2012 2003–2012 2003–2012
IHDI is calculated. Column 5: Calculated as the arithmetic mean of the values in columns 6, 8 and 10 using the methodology in Technical note 2 (available at http://hdr.undp.org). Column 6: Calculated based on abridged life tables from UNDESA (2013a). Column 7: Calculated based on data in column 6 and the unadjusted life expectancy index. Columns 8 and 10: Calculated based on data from the Luxembourg Income Study database, Eurostat’s European Union Statistics on Income and Living Conditions, the World Bank’s International Income Distribution Database, United Nations Children’s Fund Multiple Indicator Cluster Surveys, and ICF Macro Demographic and Health Surveys using the methodology in Technical note 2 (available at http:// hdr.undp.org). Column 9: Calculated based on data in column 8 and the unadjusted education index. Column 11: Calculated based on data in column 10 and the unadjusted income index. Columns 12 and 13: HDRO calculations based on data from World Bank (2013a). Column 14: World Bank 2013a.
TABLE 3 Inequality-adjusted Human Development Index | 171
TABLE
3