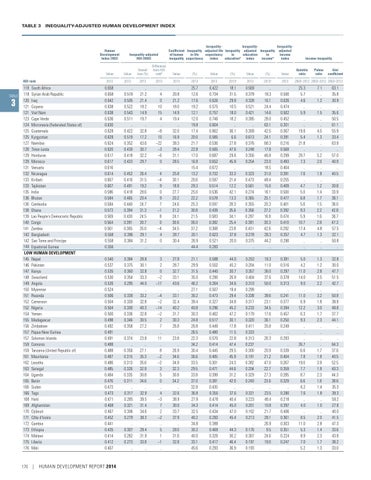
TABLE 3 INEQUALITY-ADJUSTED HUMAN DEVELOPMENT INDEX
Human Development Index (HDI)
HDI rank
TABLE
3
118 South Africa 118 Syrian Arab Republic 120 Iraq 121 Guyana 121 Viet Nam 123 Cape Verde 124 Micronesia (Federated States of) 125 Guatemala 125 Kyrgyzstan 127 Namibia 128 Timor-Leste 129 Honduras 129 Morocco 131 Vanuatu 132 Nicaragua 133 Kiribati 133 Tajikistan 135 India 136 Bhutan 136 Cambodia 138 Ghana 139 Lao People's Democratic Republic 140 Congo 141 Zambia 142 Bangladesh 142 Sao Tome and Principe 144 Equatorial Guinea LOW HUMAN DEVELOPMENT 145 Nepal 146 Pakistan 147 Kenya 148 Swaziland 149 Angola 150 Myanmar 151 Rwanda 152 Cameroon 152 Nigeria 154 Yemen 155 Madagascar 156 Zimbabwe 157 Papua New Guinea 157 Solomon Islands 159 Comoros 159 Tanzania (United Republic of) 161 Mauritania 162 Lesotho 163 Senegal 164 Uganda 165 Benin 166 Sudan 166 Togo 168 Haiti 169 Afghanistan 170 Djibouti 171 Côte d'Ivoire 172 Gambia 173 Ethiopia 174 Malawi 175 Liberia 176 Mali
170
Inequality-adjusted HDI (IHDI)
InequalityInequalityInequalityCoefficient Inequality adjusted life Inequality adjusted Inequality adjusted expectancy education income of human in life in in index index inequality expectancy educationa index incomea
Income inequality
Value
Value
Overall loss (%)
Difference from HDI rankb
2013
2013
2013
2013
2013
2013
2013
2013c
2013
2013c
2013
0.658 0.658 0.642 0.638 0.638 0.636 0.630 0.628 0.628 0.624 0.620 0.617 0.617 0.616 0.614 0.607 0.607 0.586 0.584 0.584 0.573 0.569 0.564 0.561 0.558 0.558 0.556
.. 0.518 0.505 0.522 0.543 0.511 .. 0.422 0.519 0.352 0.430 0.418 0.433 .. 0.452 0.416 0.491 0.418 0.465 0.440 0.394 0.430 0.391 0.365 0.396 0.384 ..
.. 21.2 21.4 18.2 14.9 19.7 .. 32.8 17.2 43.6 30.7 32.2 29.7 .. 26.4 31.5 19.2 28.6 20.4 24.7 31.3 24.5 30.7 35.0 29.1 31.2 ..
.. 4 0 10 15 4 .. –8 10 –22 –3 –6 0 .. 4 –4 9 0 9 7 –1 8 0 –4 4 0 ..
.. 20.8 21.2 18.0 14.9 19.4 .. 32.0 16.9 39.3 29.4 31.1 28.5 .. 25.8 30.1 18.8 27.7 20.2 24.6 31.2 24.1 30.6 34.5 28.7 30.4 ..
25.7 12.6 17.6 19.2 12.1 12.0 19.8 17.4 20.0 21.7 22.8 17.0 16.8 15.4 13.2 20.6 29.3 25.0 22.2 25.3 30.8 21.5 36.0 37.2 20.1 26.9 44.4
0.422 0.734 0.626 0.575 0.757 0.746 0.604 0.662 0.585 0.536 0.565 0.687 0.652 0.672 0.732 0.597 0.514 0.536 0.578 0.597 0.438 0.583 0.382 0.368 0.623 0.521 0.283
18.1 31.5 29.8 10.5 18.0 18.2 .. 36.1 6.6 27.8 47.6 29.6 45.8 .. 33.3 21.4 12.2 42.1 13.3 28.3 35.6 34.1 25.4 23.8 37.8 20.0 ..
0.569 0.379 0.328 0.521 0.421 0.395 .. 0.309 0.613 0.376 0.248 0.356 0.254 .. 0.323 0.473 0.561 0.274 0.365 0.355 0.356 0.287 0.381 0.451 0.278 0.375 ..
.. 18.3 16.1 24.4 14.6 28.0 63.1 42.5 24.1 68.3 17.8 46.8 23.0 18.5 31.0 48.4 15.0 16.1 25.1 20.3 27.2 16.8 30.3 42.6 28.3 44.2 ..
.. 0.500 0.626 0.474 0.502 0.452 0.201 0.367 0.391 0.216 0.568 0.299 0.493 0.404 0.391 0.255 0.409 0.500 0.477 0.401 0.392 0.474 0.410 0.292 0.357 0.290 ..
25.3 5.7 4.6 .. 5.9 .. .. 19.6 5.4 21.8 .. 29.7 7.3 .. 7.6 .. 4.7 5.0 6.8 5.6 9.3 5.9 10.7 17.4 4.7 .. ..
7.1 .. 1.2 .. 1.5 .. .. 4.5 1.3 .. .. 5.2 2.0 .. 1.9 .. 1.2 1.4 1.7 1.5 2.2 1.6 2.8 4.8 1.3 .. ..
63.1 35.8 30.9 .. 35.6 50.5 61.1 55.9 33.4 63.9 .. 57.0 40.9 .. 40.5 .. 30.8 33.9 38.1 36.0 42.8 36.7 47.3 57.5 32.1 50.8 ..
0.540 0.537 0.535 0.530 0.526 0.524 0.506 0.504 0.504 0.500 0.498 0.492 0.491 0.491 0.488 0.488 0.487 0.486 0.485 0.484 0.476 0.473 0.473 0.471 0.468 0.467 0.452 0.441 0.435 0.414 0.412 0.407
0.384 0.375 0.360 0.354 0.295 .. 0.338 0.339 0.300 0.336 0.346 0.358 .. 0.374 .. 0.356 0.315 0.313 0.326 0.335 0.311 .. 0.317 0.285 0.321 0.306 0.279 .. 0.307 0.282 0.273 ..
28.8 30.1 32.8 33.3 44.0 .. 33.2 32.8 40.3 32.8 30.5 27.2 .. 23.8 .. 27.1 35.3 35.6 32.9 30.8 34.6 .. 32.9 39.5 31.4 34.6 38.3 .. 29.4 31.9 33.8 ..
3 2 0 –2 –17 .. –4 –2 –14 –2 2 7 .. 11 .. 8 –2 –2 3 5 0 .. 4 –3 7 2 –2 .. 5 1 –1 ..
27.8 28.7 32.7 33.1 43.6 .. 33.1 32.4 40.2 31.7 30.3 26.8 .. 23.8 .. 26.9 34.6 34.9 32.3 30.8 34.2 .. 32.6 38.9 30.0 33.7 37.9 .. 28.0 31.6 32.8 ..
21.1 29.9 31.5 35.0 46.2 27.1 30.2 39.4 40.8 30.3 24.8 26.8 26.5 22.3 34.2 30.4 36.6 33.5 29.5 33.8 37.0 32.8 36.8 27.9 34.3 32.5 40.2 34.8 30.2 40.0 33.1 45.6
0.588 0.502 0.440 0.290 0.264 0.507 0.473 0.327 0.296 0.462 0.517 0.449 0.480 0.570 0.414 0.445 0.405 0.301 0.471 0.399 0.381 0.435 0.355 0.478 0.414 0.434 0.283 0.389 0.469 0.326 0.417 0.293
44.0 45.2 30.7 26.8 34.6 19.4 29.4 34.8 45.2 47.2 30.1 17.8 11.5 22.8 47.4 29.5 45.9 24.3 44.6 31.2 42.0 .. 37.6 40.4 45.0 47.0 45.4 .. 44.3 30.2 46.4 36.9
0.253 0.204 0.357 0.404 0.310 0.299 0.338 0.317 0.233 0.179 0.320 0.411 0.333 0.313 0.237 0.300 0.191 0.382 0.204 0.329 0.240 .. 0.321 0.223 0.201 0.162 0.213 .. 0.176 0.307 0.197 0.193
18.3 11.0 36.0 37.6 50.0 .. 39.6 23.1 34.5 17.6 36.1 35.8 .. 26.3 .. 20.9 21.2 47.0 22.7 27.3 23.6 .. 23.5 48.4 10.8 21.7 28.1 26.9 9.5 24.6 19.0 ..
0.381 0.516 0.297 0.378 0.313 .. 0.241 0.377 0.394 0.457 0.250 0.249 .. 0.293 .. 0.339 0.404 0.267 0.359 0.285 0.329 .. 0.280 0.218 0.397 0.406 0.361 0.303 0.351 0.224 0.247 ..
5.0 4.2 11.0 14.0 9.0 .. 11.0 6.9 12.2 6.3 9.3 .. .. .. 26.7 6.6 7.8 19.0 7.7 8.7 6.6 6.2 7.6 .. 4.0 .. 8.5 11.0 5.3 8.9 7.0 5.2
1.3 1.2 2.8 3.5 2.2 .. 3.2 1.8 3.0 1.7 2.3 .. .. .. .. 1.7 1.9 3.9 1.9 2.3 1.8 1.4 1.8 .. 1.0 .. 2.0 2.8 1.4 2.3 1.7 1.3
32.8 30.0 47.7 51.5 42.7 .. 50.8 38.9 48.8 37.7 44.1 .. .. .. 64.3 37.6 40.5 52.5 40.3 44.3 38.6 35.3 39.3 59.2 27.8 40.0 41.5 47.3 33.6 43.9 38.2 33.0
| HUMAN DEVELOPMENT REPORT 2014
Value
(%)
Value
(%)
Value
(%)
Value
Quintile ratio
Palma ratio
Gini coefficient
2003–2012 2003–2012 2003–2012