HUMAN DEVELOPMENT REPORT 2014 Sustaining Human Progress Reducing Vulnerabilities and Building Resilience
Human Development Index (HDI)
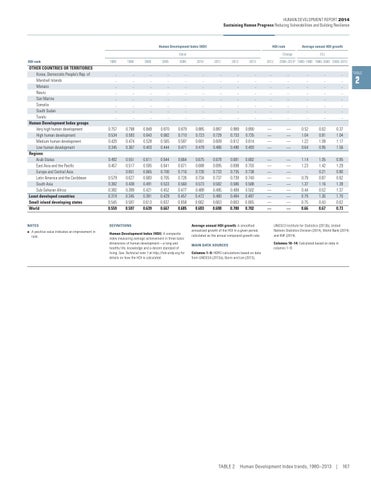
HDI rank
OTHER COUNTRIES OR TERRITORIES Korea, Democratic People’s Rep. of Marshall Islands Monaco Nauru San Marino Somalia South Sudan Tuvalu Human Development Index groups Very high human development High human development Medium human development Low human development Regions Arab States East Asia and the Pacific Europe and Central Asia Latin America and the Caribbean South Asia Sub-Saharan Africa Least developed countries Small island developing states World
HDI rank
Average annual HDI growth
Value
Change
(%)
2012
2008–2013a
1980–1990 1990–2000 2000–2013
.. .. .. .. .. .. .. ..
.. .. .. .. .. .. .. ..
1980
1990
2000
2005
2008
2010
2011
2012
2013
.. .. .. .. .. .. .. ..
.. .. .. .. .. .. .. ..
.. .. .. .. .. .. .. ..
.. .. .. .. .. .. .. ..
.. .. .. .. .. .. .. ..
.. .. .. .. .. .. .. ..
.. .. .. .. .. .. .. ..
.. .. .. .. .. .. .. ..
.. .. .. .. .. .. .. ..
0.757 0.534 0.420 0.345
0.798 0.593 0.474 0.367
0.849 0.643 0.528 0.403
0.870 0.682 0.565 0.444
0.879 0.710 0.587 0.471
0.885 0.723 0.601 0.479
0.887 0.729 0.609 0.486
0.889 0.733 0.612 0.490
0.890 0.735 0.614 0.493
— — — —
0.492 0.457 .. 0.579 0.382 0.382 0.319 0.545 0.559
0.551 0.517 0.651 0.627 0.438 0.399 0.345 0.587 0.597
0.611 0.595 0.665 0.683 0.491 0.421 0.391 0.613 0.639
0.644 0.641 0.700 0.705 0.533 0.452 0.429 0.637 0.667
0.664 0.671 0.716 0.726 0.560 0.477 0.457 0.658 0.685
0.675 0.688 0.726 0.734 0.573 0.488 0.472 0.662 0.693
0.678 0.695 0.733 0.737 0.582 0.495 0.480 0.663 0.698
0.681 0.699 0.735 0.739 0.586 0.499 0.484 0.663 0.700
0.682 0.703 0.738 0.740 0.588 0.502 0.487 0.665 0.702
— — — — — — — — —
NOTES
DEFINITIONS
a A positive value indicates an improvement in rank.
Human Development Index (HDI): A composite index measuring average achievement in three basic dimensions of human development—a long and healthy life, knowledge and a decent standard of living. See Technical note 1 at http://hdr.undp.org for details on how the HDI is calculated.
.. .. .. .. .. .. .. ..
.. .. .. .. .. .. .. ..
.. .. .. .. .. .. .. ..
— — — —
0.52 1.04 1.22 0.64
0.62 0.81 1.09 0.95
0.37 1.04 1.17 1.56
— — — — — — — — —
1.14 1.23 .. 0.79 1.37 0.44 0.79 0.75 0.66
1.05 1.42 0.21 0.87 1.16 0.52 1.26 0.43 0.67
0.85 1.29 0.80 0.62 1.39 1.37 1.70 0.62 0.73
Average annual HDI growth: A smoothed annualized growth of the HDI in a given period, calculated as the annual compound growth rate.
UNESCO Institute for Statistics (2013b), United Nations Statistics Division (2014), World Bank (2014) and IMF (2014).
MAIN DATA SOURCES
Columns 10–14: Calculated based on data in columns 1–9.
Columns 1–9: HDRO calculations based on data from UNDESA (2013a), Barro and Lee (2013),
TABLE 2 Human Development Index trends, 1980–2013 | 167
TABLE
2