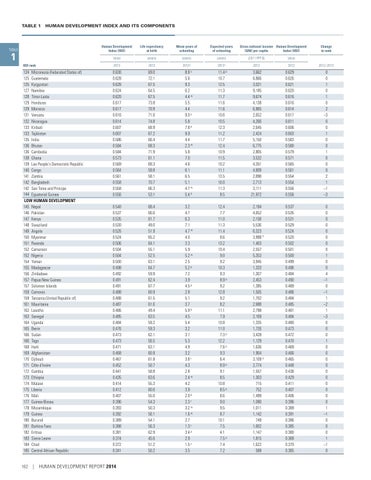
TABLE 1 HUMAN DEVELOPMENT INDEX AND ITS COMPONENTS
TABLE
1
Human Development Index (HDI)
Life expectancy at birth
Mean years of schooling
Expected years of schooling
Gross national income Human Development (GNI) per capita Index (HDI)
Value
(years)
(years)
(years)
(2011 PPP $)
HDI rank
2013
2013
2012a
2012a
2013
124 Micronesia (Federated States of) 125 Guatemala 125 Kyrgyzstan 127 Namibia 128 Timor-Leste 129 Honduras 129 Morocco 131 Vanuatu 132 Nicaragua 133 Kiribati 133 Tajikistan 135 India 136 Bhutan 136 Cambodia 138 Ghana 139 Lao People's Democratic Republic 140 Congo 141 Zambia 142 Bangladesh 142 Sao Tome and Principe 144 Equatorial Guinea LOW HUMAN DEVELOPMENT 145 Nepal 146 Pakistan 147 Kenya 148 Swaziland 149 Angola 150 Myanmar 151 Rwanda 152 Cameroon 152 Nigeria 154 Yemen 155 Madagascar 156 Zimbabwe 157 Papua New Guinea 157 Solomon Islands 159 Comoros 159 Tanzania (United Republic of) 161 Mauritania 162 Lesotho 163 Senegal 164 Uganda 165 Benin 166 Sudan 166 Togo 168 Haiti 169 Afghanistan 170 Djibouti 171 Côte d'Ivoire 172 Gambia 173 Ethiopia 174 Malawi 175 Liberia 176 Mali 177 Guinea-Bissau 178 Mozambique 179 Guinea 180 Burundi 181 Burkina Faso 182 Eritrea 183 Sierra Leone 184 Chad 185 Central African Republic
0.630 0.628 0.628 0.624 0.620 0.617 0.617 0.616 0.614 0.607 0.607 0.586 0.584 0.584 0.573 0.569 0.564 0.561 0.558 0.558 0.556
69.0 72.1 67.5 64.5 67.5 73.8 70.9 71.6 74.8 68.9 67.2 66.4 68.3 71.9 61.1 68.3 58.8 58.1 70.7 66.3 53.1
8.8 s 5.6 9.3 6.2 4.4 w 5.5 4.4 9.0 o 5.8 7.8 p 9.9 4.4 2.3 w 5.8 7.0 4.6 6.1 6.5 5.1 4.7 w 5.4 p
11.4 p 10.7 12.5 11.3 11.7 11.6 11.6 10.6 10.5 12.3 11.2 11.7 12.4 10.9 11.5 10.2 11.1 13.5 10.0 11.3 8.5
3,662 6,866 3,021 9,185 9,674 4,138 6,905 2,652 4,266 2,645 2,424 5,150 6,775 2,805 3,532 4,351 4,909 2,898 2,713 3,111 21,972
0.540 0.537 0.535 0.530 0.526 0.524 0.506 0.504 0.504 0.500 0.498 0.492 0.491 0.491 0.488 0.488 0.487 0.486 0.485 0.484 0.476 0.473 0.473 0.471 0.468 0.467 0.452 0.441 0.435 0.414 0.412 0.407 0.396 0.393 0.392 0.389 0.388 0.381 0.374 0.372 0.341
68.4 66.6 61.7 49.0 51.9 65.2 64.1 55.1 52.5 63.1 64.7 59.9 62.4 67.7 60.9 61.5 61.6 49.4 63.5 59.2 59.3 62.1 56.5 63.1 60.9 61.8 50.7 58.8 63.6 55.3 60.6 55.0 54.3 50.3 56.1 54.1 56.3 62.9 45.6 51.2 50.2
3.2 4.7 6.3 7.1 4.7 w 4.0 3.3 5.9 5.2 w 2.5 5.2 p 7.2 3.9 4.5 p 2.8 5.1 3.7 5.9 b 4.5 5.4 3.2 3.1 5.3 4.9 3.2 3.8 r 4.3 2.8 2.4 w 4.2 3.9 2.0 b 2.3 r 3.2 w 1.6 w 2.7 1.3 r 3.4 p 2.9 1.5 s 3.5
12.4 7.7 11.0 11.3 11.4 8.6 13.2 10.4 9.0 9.2 10.3 9.3 8.9 p 9.2 12.8 9.2 8.2 11.1 7.9 10.8 11.0 7.3 p 12.2 7.6 p 9.3 6.4 8.9 p 9.1 8.5 10.8 8.5 p 8.6 9.0 9.5 8.7 10.1 7.5 4.1 7.5 p 7.4 7.2
162
| HUMAN DEVELOPMENT REPORT 2014
2,194 4,652 2,158 5,536 6,323 3,998 h 1,403 2,557 5,353 3,945 1,333 1,307 2,453 1,385 1,505 1,702 2,988 2,798 2,169 1,335 1,726 3,428 1,129 1,636 1,904 3,109 h 2,774 1,557 1,303 715 752 1,499 1,090 1,011 1,142 749 1,602 1,147 1,815 1,622 588
Change in rank
Value 2012
2012–2013
0.629 0.626 0.621 0.620 0.616 0.616 0.614 0.617 0.611 0.606 0.603 0.583 0.580 0.579 0.571 0.565 0.561 0.554 0.554 0.556 0.556
0 0 1 0 1 0 2 –3 0 0 1 0 0 1 0 0 0 2 1 –1 –3
0.537 0.535 0.531 0.529 0.524 0.520 0.502 0.501 0.500 0.499 0.496 0.484 0.490 0.489 0.486 0.484 0.485 0.481 0.484 0.480 0.473 0.472 0.470 0.469 0.466 0.465 0.448 0.438 0.429 0.411 0.407 0.406 0.396 0.389 0.391 0.386 0.385 0.380 0.368 0.370 0.365
0 0 0 0 0 0 0 0 1 0 0 4 –1 0 –1 1 –2 1 –3 0 0 0 1 0 0 0 0 0 0 0 0 0 0 1 –1 0 0 0 1 –1 0