TABLE
1
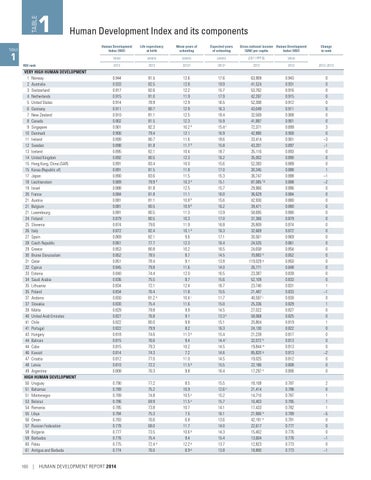
Human Development Index and its components
TABLE
1
HDI rank
VERY HIGH HUMAN DEVELOPMENT 1 Norway 2 Australia 3 Switzerland 4 Netherlands 5 United States 6 Germany 7 New Zealand 8 Canada 9 Singapore 10 Denmark 11 Ireland 12 Sweden 13 Iceland 14 United Kingdom 15 Hong Kong, China (SAR) 15 Korea (Republic of) 17 Japan 18 Liechtenstein 19 Israel 20 France 21 Austria 21 Belgium 21 Luxembourg 24 Finland 25 Slovenia 26 Italy 27 Spain 28 Czech Republic 29 Greece 30 Brunei Darussalam 31 Qatar 32 Cyprus 33 Estonia 34 Saudi Arabia 35 Lithuania 35 Poland 37 Andorra 37 Slovakia 39 Malta 40 United Arab Emirates 41 Chile 41 Portugal 43 Hungary 44 Bahrain 44 Cuba 46 Kuwait 47 Croatia 48 Latvia 49 Argentina HIGH HUMAN DEVELOPMENT 50 Uruguay 51 Bahamas 51 Montenegro 53 Belarus 54 Romania 55 Libya 56 Oman 57 Russian Federation 58 Bulgaria 59 Barbados 60 Palau 61 Antigua and Barbuda
160
Human Development Index (HDI)
Life expectancy at birth
Mean years of schooling
Expected years of schooling
Value
(years)
(years)
(years)
(2011 PPP $)
Value
2013
2013
2012a
2012a
2013
2012
0.944 0.933 0.917 0.915 0.914 0.911 0.910 0.902 0.901 0.900 0.899 0.898 0.895 0.892 0.891 0.891 0.890 0.889 0.888 0.884 0.881 0.881 0.881 0.879 0.874 0.872 0.869 0.861 0.853 0.852 0.851 0.845 0.840 0.836 0.834 0.834 0.830 0.830 0.829 0.827 0.822 0.822 0.818 0.815 0.815 0.814 0.812 0.810 0.808
81.5 82.5 82.6 81.0 78.9 80.7 81.1 81.5 82.3 79.4 80.7 81.8 82.1 80.5 83.4 81.5 83.6 79.9 d 81.8 81.8 81.1 80.5 80.5 80.5 79.6 82.4 82.1 77.7 80.8 78.5 78.4 79.8 74.4 75.5 72.1 76.4 81.2 d 75.4 79.8 76.8 80.0 79.9 74.6 76.6 79.3 74.3 77.0 72.2 76.3
12.6 12.8 12.2 11.9 12.9 12.9 12.5 12.3 10.2 b 12.1 11.6 11.7 b 10.4 12.3 10.0 11.8 11.5 10.3 e 12.5 11.1 10.8 b 10.9 b 11.3 10.3 11.9 10.1 b 9.6 12.3 10.2 8.7 9.1 11.6 12.0 8.7 12.4 11.8 10.4 i 11.6 9.9 9.1 9.8 8.2 11.3 b 9.4 10.2 7.2 11.0 11.5 b 9.8
17.6 19.9 15.7 17.9 16.5 16.3 19.4 15.9 15.4 c 16.9 18.6 15.8 18.7 16.2 15.6 17.0 15.3 15.1 15.7 16.0 15.6 16.2 13.9 17.0 16.8 16.3 17.1 16.4 16.5 14.5 13.8 14.0 16.5 15.6 16.7 15.5 11.7 15.0 14.5 13.3 k 15.1 16.3 15.4 14.4 l 14.5 14.6 14.5 15.5 16.4
63,909 41,524 53,762 42,397 52,308 43,049 32,569 41,887 72,371 42,880 33,414 43,201 35,116 35,002 52,383 30,345 36,747 87,085 f,g 29,966 36,629 42,930 39,471 58,695 37,366 26,809 32,669 30,561 24,535 24,658 70,883 h 119,029 g 26,771 23,387 52,109 23,740 21,487 40,597 j 25,336 27,022 58,068 20,804 24,130 21,239 32,072 h 19,844 m 85,820 g 19,025 22,186 17,297 h
0.943 0.931 0.916 0.915 0.912 0.911 0.908 0.901 0.899 0.900 0.901 0.897 0.893 0.890 0.889 0.888 0.888 0.888 0.886 0.884 0.880 0.880 0.880 0.879 0.874 0.872 0.869 0.861 0.854 0.852 0.850 0.848 0.839 0.833 0.831 0.833 0.830 0.829 0.827 0.825 0.819 0.822 0.817 0.813 0.813 0.813 0.812 0.808 0.806
0 0 0 0 0 0 0 0 3 0 –3 –1 0 0 0 1 –1 –2 0 0 0 0 0 0 0 0 0 0 0 0 0 0 0 0 1 –1 0 1 0 0 1 0 0 0 0 –2 0 0 0
0.790 0.789 0.789 0.786 0.785 0.784 0.783 0.778 0.777 0.776 0.775 0.774
77.2 75.2 74.8 69.9 73.8 75.3 76.6 68.0 73.5 75.4 72.4 d 76.0
8.5 10.9 10.5 o 11.5 o 10.7 7.5 6.8 11.7 10.6 b 9.4 12.2 p 8.9 p
15.5 12.6 n 15.2 15.7 14.1 16.1 13.6 14.0 14.3 15.4 13.7 13.8
18,108 21,414 14,710 16,403 17,433 21,666 h 42,191 h 22,617 15,402 13,604 12,823 18,800
0.787 0.788 0.787 0.785 0.782 0.789 0.781 0.777 0.776 0.776 0.773 0.773
2 0 1 1 1 –5 0 0 0 –1 0 –1
| HUMAN DEVELOPMENT REPORT 2014
Gross national income Human Development (GNI) per capita Index (HDI)
Change in rank
2012–2013