HUMAN DEVELOPMENT REPORT 2014 Sustaining Human Progress Reducing Vulnerabilities and Building Resilience
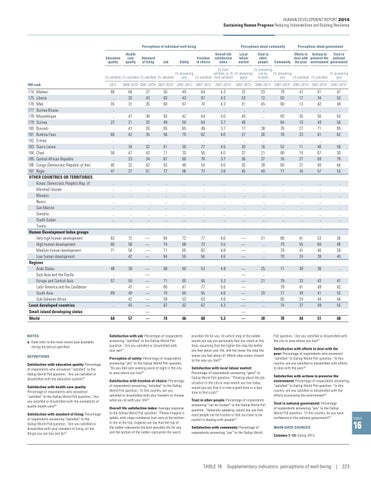
Perceptions of individual well-being Education quality
Health care quality
Standard of living
Job
(% satisfied) (% satisfied) (% satisfied) (% satisfied)
Perceptions about community Freedom of choice
Safety
Overall life satisfaction index
Local labour market
Trust in other people
Perceptions about government
Efforts to Actions to Trust in deal with preserve the national Community the poor environment government
(0, least (% answering satisfied, to 10, (% answering can be (% answering (% answering (% answering trusted) yes) good) yes) yes) (% satisfied) most satisfied) (% satisfied) (% satisfied)
HDI rank
2012
2007–2012
2007–2012a
2007–2012a
2009–2011a
174 Malawi 175 Liberia 176 Mali 177 Guinea-Bissau 178 Mozambique 179 Guinea 180 Burundi 181 Burkina Faso 182 Eritrea 183 Sierra Leone 184 Chad 185 Central African Republic 186 Congo (Democratic Republic of the) 187 Niger OTHER COUNTRIES OR TERRITORIES Korea, Democratic People’s Rep. of Marshall Islands Monaco Nauru San Marino Somalia South Sudan Tuvalu Human Development Index groups Very high human development High human development Medium human development Low human development Regions Arab States East Asia and the Pacific Europe and Central Asia Latin America and the Caribbean South Asia Sub-Saharan Africa Least developed countries
66 .. 35 .. .. 22 .. 66 .. .. 58 .. 40 47
64 32 31 .. 47 21 41 42 .. 34 47 23 32 37
37 43 26 .. 38 20 26 35 .. 32 42 34 42 57
50 63 60 .. 63 49 65 56 .. 61 71 67 55 72
49 43 67 .. 42 50 65 70 .. 50 33 60 48 86
64 87 70 .. 64 64 49 62 .. 77 56 78 54 73
4.3 4.2 4.3 .. 5.0 3.7 3.7 4.0 .. 4.5 4.0 3.7 4.6 3.8
32 53 31 .. 45 46 17 27 .. 30 37 36 35 45
33 12 45 .. .. .. 38 26 .. 16 21 37 39 40
78 63 60 .. 83 64 76 78 .. 52 68 76 60 77
47 17 13 .. 35 10 27 23 .. 11 19 27 27 34
61 34 42 .. 55 43 71 61 .. 46 67 69 40 57
47 53 49 .. 63 56 85 62 .. 58 30 78 44 53
.. .. .. .. .. .. .. ..
.. .. .. .. .. .. .. ..
.. .. .. .. .. .. .. ..
.. .. .. .. .. .. .. ..
.. .. .. .. .. .. .. ..
.. .. .. .. .. .. .. ..
.. .. .. .. .. .. .. ..
.. .. .. .. .. .. .. ..
.. .. .. .. .. .. .. ..
.. .. .. .. .. .. .. ..
.. .. .. .. .. .. .. ..
.. .. .. .. .. .. .. ..
.. .. .. .. .. .. .. ..
63 60 71 ..
72 58 54 42
— — — —
84 74 71 64
72 68 65 55
77 73 62 56
6.6 5.5 4.8 4.6
— — — —
31 .. .. ..
86 79 78 70
41 55 41 24
53 60 46 39
36 48 59 40
48 .. 57 .. 69 .. ..
39 .. 50 47 49 42 45
— — — — — — —
68 .. 71 80 70 59 67
60 .. 60 47 60 53 62
53 .. 56 77 55 63 62
4.8 .. 5.3 6.6 4.6 4.6 4.3
— — — — — — —
25 .. 21 .. 20 .. ..
71 .. 79 78 77 65 74
39 .. 33 41 39 24 37
36 .. 43 49 41 44 49
.. .. 47 42 52 44 55
Small island developing states World
NOTES a Data refer to the most recent year available during the period specified. DEFINITIONS Satisfaction with education quality: Percentage of respondents who answered “satisfied” to the Gallup World Poll question, “Are you satisfied or dissatisfied with the education system?” Satisfaction with health care quality: Percentage of respondents who answered “satisfied” to the Gallup World Poll question, “Are you satisfied or dissatisfied with the availability of quality health care?” Satisfaction with standard of living: Percentage of respondents answering “satisfied” to the Gallup World Poll question, “Are you satisfied or dissatisfied with your standard of living, all the things you can buy and do?”
2008–2012a 2007–2013a 2007–2012a 2007–2012
2007–2012a 2007–2013a 2007–2013a
2007–2012a
..
..
—
..
..
..
..
—
..
..
..
..
..
64
57
—
74
66
68
5.3
—
30
78
44
51
48
Satisfaction with job: Percentage of respondents answering “satisfied” to the Gallup World Poll question, “Are you satisfied or dissatisfied with your job?” Perception of safety: Percentage of respondents answering “yes” to the Gallup World Poll question, “Do you feel safe walking alone at night in the city or area where you live?” Satisfaction with freedom of choice: Percentage of respondents answering “satisfied” to the Gallup World Poll question, “In this country, are you satisfied or dissatisfied with your freedom to choose what you do with your life?” Overall life satisfaction index: Average response to the Gallup World Poll question: “Please imagine a ladder, with steps numbered from zero at the bottom to ten at the top. Suppose we say that the top of the ladder represents the best possible life for you, and the bottom of the ladder represents the worst
possible life for you. On which step of the ladder would you say you personally feel you stand at this time, assuming that the higher the step the better you feel about your life, and the lower the step the worse you feel about it? Which step comes closest to the way you feel?” Satisfaction with local labour market: Percentage of respondents answering “good” to Gallup World Poll question, “Thinking about the job situation in the city or area where you live today, would you say that it is now a good time or a bad time to find a job?” Trust in other people: Percentage of respondents answering “can be trusted” to the Gallup World Poll question, “Generally speaking, would you say that most people can be trusted or that you have to be careful in dealing with people?” Satisfaction with community: Percentage of respondents answering “yes” to the Gallup World
Poll question, “Are you satisfied or dissatisfied with the city or area where you live?” Satisfaction with efforts to deal with the poor: Percentage of respondents who answered “satisfied” to Gallup World Poll question, “In this country, are you satisfied or dissatisfied with efforts to deal with the poor?” Satisfaction with actions to preserve the environment: Percentage of respondents answering “satisfied” to Gallup World Poll question: “In this country, are you satisfied or dissatisfied with the efforts to preserve the environment?” Trust in national government: Percentage of respondents answering “yes” to the Gallup World Poll question, “In this country, do you have confidence in the national government?” MAIN DATA SOURCES Columns 1–13: Gallup 2013.
TABLE 16 Supplementary indicators: perceptions of well-being | 223
TABLE
16