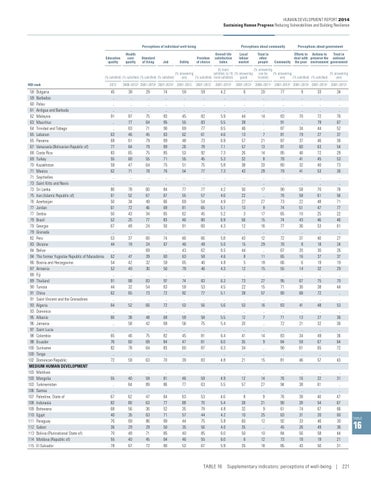
HUMAN DEVELOPMENT REPORT 2014 Sustaining Human Progress Reducing Vulnerabilities and Building Resilience
Perceptions of individual well-being Education quality
Health care quality
Standard of living
Job
(% satisfied) (% satisfied) (% satisfied) (% satisfied)
Safety
Perceptions about community Freedom of choice
Overall life satisfaction index
Local labour market
Trust in other people
Perceptions about government
Efforts to Actions to Trust in deal with preserve the national Community the poor environment government
(0, least (% answering satisfied, to 10, (% answering can be (% answering (% answering (% answering trusted) yes) good) yes) yes) (% satisfied) most satisfied) (% satisfied) (% satisfied)
HDI rank
2012
2007–2012
2007–2012a
2007–2012a
2009–2011a
58 Bulgaria 59 Barbados 60 Palau 61 Antigua and Barbuda 62 Malaysia 63 Mauritius 64 Trinidad and Tobago 65 Lebanon 65 Panama 67 Venezuela (Bolivarian Republic of) 68 Costa Rica 69 Turkey 70 Kazakhstan 71 Mexico 71 Seychelles 73 Saint Kitts and Nevis 73 Sri Lanka 75 Iran (Islamic Republic of) 76 Azerbaijan 77 Jordan 77 Serbia 79 Brazil 79 Georgia 79 Grenada 82 Peru 83 Ukraine 84 Belize 84 The former Yugoslav Republic of Macedonia 86 Bosnia and Herzegovina 87 Armenia 88 Fiji 89 Thailand 90 Tunisia 91 China 91 Saint Vincent and the Grenadines 93 Algeria 93 Dominica 95 Albania 96 Jamaica 97 Saint Lucia 98 Colombia 98 Ecuador 100 Suriname 100 Tonga 102 Dominican Republic MEDIUM HUMAN DEVELOPMENT 103 Maldives 103 Mongolia 103 Turkmenistan 106 Samoa 107 Palestine, State of 108 Indonesia 109 Botswana 110 Egypt 111 Paraguay 112 Gabon 113 Bolivia (Plurinational State of) 114 Moldova (Republic of) 115 El Salvador
45 .. .. .. 91 .. .. 63 68 77 83 55 59 62 .. .. 80 61 50 61 50 52 67 .. 53 44 .. 62 54 52 .. 91 44 62 .. 64 .. 60 .. .. 65 76 82 .. 72
39 .. .. .. 87 77 63 46 61 64 65 60 47 71 .. .. 78 52 34 72 43 25 48 .. 37 18 .. 47 42 40 .. 88 32 65 .. 52 .. 38 58 .. 46 60 78 .. 59
29 .. .. .. 75 64 71 45 79 79 75 55 64 78 .. .. 60 67 49 46 34 77 24 .. 60 24 69 39 32 30 .. 83 54 73 .. 66 .. 48 42 .. 75 69 64 .. 63
74 .. .. .. 83 85 90 63 89 89 85 71 75 76 .. .. 84 67 66 69 65 83 50 .. 74 67 .. 60 59 50 .. 97 63 72 .. 72 .. 68 68 .. 82 84 83 .. 70
59 .. .. .. 45 55 69 62 48 26 53 55 51 54 .. .. 77 55 69 81 62 46 91 .. 46 46 43 63 65 78 .. 74 59 82 .. 53 .. 59 56 .. 45 47 60 .. 39
59 .. .. .. 82 83 77 61 73 78 92 45 75 77 .. .. 77 57 54 65 45 80 60 .. 66 49 62 58 40 46 .. 83 53 77 .. 56 .. 58 75 .. 81 81 87 .. 83
4.2 .. .. .. 5.9 5.5 6.5 4.6 6.9 7.1 7.3 5.3 5.8 7.3 .. .. 4.2 4.6 4.9 5.1 5.2 6.9 4.3 .. 5.8 5.0 6.5 4.6 4.8 4.3 .. 6.3 4.5 5.1 .. 5.6 .. 5.5 5.4 .. 6.4 6.0 6.3 .. 4.8
6 .. .. .. 44 38 46 13 57 57 26 32 38 43 .. .. 50 22 27 13 3 56 12 .. 43 15 44 8 5 12 .. 73 22 38 .. 53 .. 12 20 .. 41 35 34 .. 21
20 .. .. .. 14 .. .. 7 21 13 14 8 33 29 .. .. 17 .. 27 9 17 15 16 .. 12 29 .. 11 18 15 .. 27 15 57 .. 16 .. 7 .. .. 14 9 .. .. 15
77 .. .. .. 83 91 87 81 87 81 85 78 80 79 .. .. 90 76 73 74 65 74 77 .. 72 76 67 65 66 55 .. 95 71 80 .. 83 .. 71 72 .. 83 84 90 .. 81
9 .. .. .. 70 .. 34 19 37 60 40 41 32 41 .. .. 58 58 22 51 10 43 36 .. 37 8 20 16 6 14 .. 67 30 68 .. 41 .. 13 21 .. 34 59 61 .. 46
33 .. .. .. 72 79 44 27 46 63 72 45 40 53 .. .. 70 61 48 47 25 46 53 .. 40 18 30 37 19 32 .. 75 38 72 .. 48 .. 27 32 .. 49 67 65 .. 57
34 .. .. .. 76 67 52 37 36 54 28 53 73 36 .. .. 78 56 71 77 22 46 61 .. 27 24 26 37 19 29 .. 70 44 .. .. 53 .. 36 36 .. 36 64 72 .. 43
.. 55 .. .. 67 82 68 40 76 36 70 55 78
.. 40 64 .. 62 80 56 35 69 29 48 40 67
.. 59 89 .. 47 63 36 63 86 29 71 45 72
.. 81 86 .. 64 77 52 71 89 50 85 64 80
.. 46 77 .. 63 89 35 57 44 35 40 46 53
.. 59 63 .. 53 70 79 44 75 56 85 55 67
.. 4.9 5.5 .. 4.6 5.4 4.8 4.2 5.8 4.0 6.0 6.0 5.9
.. 12 57 .. 8 38 32 10 60 35 50 6 35
.. 14 27 .. 9 21 9 25 12 .. 10 12 18
.. 76 94 .. 76 90 61 63 92 45 84 73 85
.. 16 38 .. 39 28 74 31 33 26 56 18 43
.. 22 61 .. 40 54 67 20 46 49 58 19 50
.. 31 .. .. 47 67 66 60 30 36 44 21 31
2008–2012a 2007–2013a 2007–2012a 2007–2012
2007–2012a 2007–2013a 2007–2013a
2007–2012a
TABLE 16 Supplementary indicators: perceptions of well-being | 221
TABLE
16