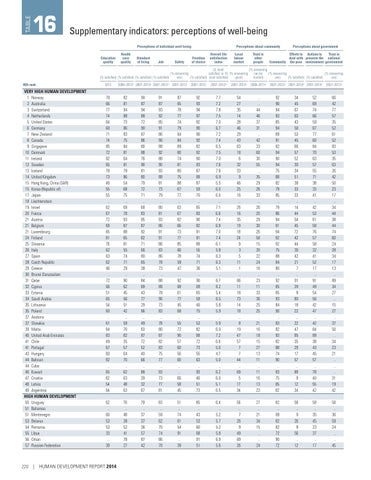
TABLE
16
Supplementary indicators: perceptions of well-being Perceptions of individual well-being Education quality
Health care quality
Standard of living
Job
(% satisfied) (% satisfied) (% satisfied) (% satisfied) HDI rank
VERY HIGH HUMAN DEVELOPMENT 1 Norway 2 Australia 3 Switzerland 4 Netherlands 5 United States 6 Germany 7 New Zealand 8 Canada 9 Singapore 10 Denmark 11 Ireland 12 Sweden 13 Iceland 14 United Kingdom 15 Hong Kong, China (SAR) 15 Korea (Republic of) 17 Japan 18 Liechtenstein 19 Israel 20 France 21 Austria 21 Belgium 21 Luxembourg 24 Finland 25 Slovenia 26 Italy 27 Spain 28 Czech Republic 29 Greece 30 Brunei Darussalam 31 Qatar 32 Cyprus 33 Estonia 34 Saudi Arabia 35 Lithuania 35 Poland 37 Andorra 37 Slovakia 39 Malta 40 United Arab Emirates 41 Chile 41 Portugal 43 Hungary 44 Bahrain 44 Cuba 46 Kuwait 47 Croatia 48 Latvia 49 Argentina HIGH HUMAN DEVELOPMENT 50 Uruguay 51 Bahamas 51 Montenegro 53 Belarus 54 Romania 55 Libya 56 Oman 57 Russian Federation
220
2012
Safety
Perceptions about community Freedom of choice
Overall life satisfaction index
Local labour market
Trust in other people
Perceptions about government
Efforts to Actions to Trust in deal with preserve the national Community the poor environment government
(0, least (% answering satisfied, to 10, (% answering can be (% answering (% answering (% answering trusted) yes) good) yes) yes) (% satisfied) most satisfied) (% satisfied) (% satisfied)
2008–2012a 2007–2013a 2007–2012a 2007–2012
2007–2012
2007–2012a
2007–2012a
2009–2011a
2007–2012a 2007–2013a 2007–2013a
2007–2012a
78 66 77 74 64 60 71 74 85 72 82 65 78 73 46 55 55 .. 62 67 72 69 65 81 76 62 63 62 46 .. 72 66 51 65 54 60 .. 61 64 83 49 67 60 82 .. 65 62 54 64
82 81 94 88 73 86 83 75 84 81 64 81 79 86 54 68 75 .. 69 78 93 87 88 65 81 55 74 71 29 .. 90 62 45 56 51 42 .. 59 70 82 35 57 64 70 .. 62 63 48 63
90 87 94 88 72 90 87 86 80 88 76 90 81 80 79 72 71 .. 68 83 95 87 92 82 71 66 80 65 38 .. 84 69 43 77 29 66 .. 49 63 87 72 52 40 66 .. 88 39 32 67
91 87 93 92 85 91 86 90 88 92 88 90 93 88 81 73 79 .. 80 81 93 86 91 91 86 83 86 78 73 .. 88 88 78 90 73 83 .. 78 80 87 82 83 75 77 .. 93 73 77 81
87 65 78 77 74 79 64 84 89 80 74 81 80 75 88 67 77 .. 63 67 82 66 73 77 85 66 78 59 47 .. 92 68 61 77 45 68 .. 55 72 90 57 60 56 60 .. .. 66 58 45
92 93 94 87 82 90 90 92 82 92 90 93 87 88 87 59 70 .. 65 83 90 82 91 91 89 55 74 71 36 .. 90 69 65 59 46 75 .. 53 82 88 72 73 55 63 .. 93 46 51 73
7.7 7.2 7.8 7.5 7.0 6.7 7.2 7.4 6.5 7.5 7.0 7.6 7.6 6.9 5.5 6.0 6.0 .. 7.1 6.6 7.4 6.9 7.0 7.4 6.1 5.8 6.3 6.3 5.1 .. 6.7 6.2 5.4 6.5 5.8 5.9 .. 5.9 6.0 7.2 6.6 5.0 4.7 5.0 .. 6.2 6.0 5.1 6.5
54 27 35 14 28 46 29 43 63 18 6 32 33 9 46 25 16 .. 26 16 35 19 18 24 9 3 5 11 1 .. 66 11 18 73 14 18 .. 8 19 47 57 7 7 44 .. 69 5 17 34
.. .. 44 46 37 31 .. 42 33 60 30 55 .. 35 29 26 33 .. 26 20 29 30 26 58 15 20 22 24 16 .. 23 11 33 36 25 25 .. 21 16 18 15 27 13 11 .. 11 16 13 23
92 90 94 93 85 94 89 91 92 94 90 94 75 88 82 79 85 .. 79 86 94 91 94 92 92 75 88 84 80 .. 92 85 85 93 84 90 .. 83 82 93 82 88 74 90 .. 93 75 85 82
34 45 67 63 43 50 53 45 66 57 52 30 34 51 38 33 33 .. 14 44 54 45 72 42 44 30 42 21 7 .. 91 39 8 80 18 22 .. 22 47 85 35 29 17 57 .. 89 9 12 34
52 69 74 66 59 67 77 60 84 70 63 57 55 71 38 33 41 .. 42 53 61 58 76 57 58 32 41 52 17 .. 91 49 54 56 42 47 .. 42 64 89 38 43 45 57 .. 78 40 55 42
66 42 77 57 35 52 61 52 83 53 35 63 26 42 50 23 17 .. 34 44 38 44 74 60 24 28 34 17 13 .. 89 34 27 .. 15 27 .. 37 50 .. 34 23 21 .. .. .. 31 19 42
62 .. 60 53 53 33 .. 39
76 .. 48 38 52 41 78 27
79 .. 37 37 36 57 87 42
83 .. 59 62 70 74 86 70
51 .. 74 61 54 91 .. 39
85 .. 43 53 60 68 91 51
6.4 .. 5.2 5.7 5.2 5.8 6.9 5.6
56 .. 7 26 9 49 69 26
27 .. 21 34 15 .. .. 24
82 .. 69 82 82 72 90 72
58 .. 9 26 8 56 .. 12
58 .. 35 45 23 37 .. 17
58 .. 36 59 24 .. .. 45
| HUMAN DEVELOPMENT REPORT 2014