HUMAN DEVELOPMENT REPORT 2014 Sustaining Human Progress Reducing Vulnerabilities and Building Resilience
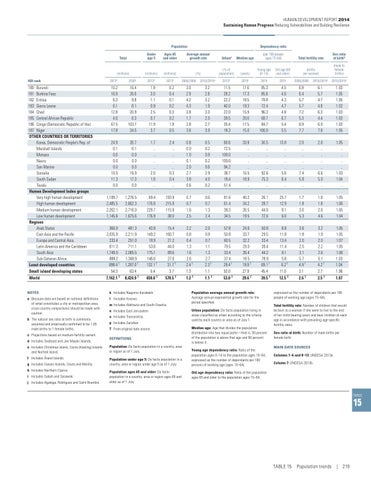
Population
Dependency ratio
Total
Under age 5
Ages 65 and older
Average annual growth rate
Urbana
Median age
(millions)
(millions)
(millions)
(%)
(% of population)
(years)
Young age (0–14)
Old age (65 and older)
(per 100 people ages 15–64)
Total fertility rate
Sex ratio at birthb
(births per woman)
(male to female births)
HDI rank
2013c
2030c
2013c
2013c
2000/2005
2010/2015c
2013c
2015c
2015
2015
2000/2005
2010/2015c
2010/2015c
180 Burundi 181 Burkina Faso 182 Eritrea 183 Sierra Leone 184 Chad 185 Central African Republic 186 Congo (Democratic Republic of the) 187 Niger OTHER COUNTRIES OR TERRITORIES Korea, Democratic People’s Rep. of Marshall Islands Monaco Nauru San Marino Somalia South Sudan Tuvalu Human Development Index groups Very high human development High human development Medium human development Low human development Regions Arab States East Asia and the Pacific Europe and Central Asia Latin America and the Caribbean South Asia Sub-Saharan Africa Least developed countries
10.2 16.9 6.3 6.1 12.8 4.6 67.5 17.8
16.4 26.6 9.8 8.1 20.9 6.3 103.7 34.5
1.9 3.0 1.1 0.9 2.5 0.7 11.9 3.7
0.2 0.4 0.1 0.2 0.3 0.2 1.9 0.5
3.0 2.9 4.2 4.3 3.8 1.7 2.8 3.6
3.2 2.8 3.2 1.9 3.0 2.0 2.7 3.9
11.5 28.2 22.2 40.0 22.0 39.5 35.4 18.3
17.6 17.3 18.5 19.3 15.9 20.0 17.5 15.0
85.3 85.6 78.8 72.4 96.3 68.7 84.7 106.0
4.5 4.6 4.3 4.7 4.8 6.7 5.4 5.5
6.9 6.4 5.7 5.7 7.2 5.3 6.9 7.7
6.1 5.7 4.7 4.8 6.3 4.4 6.0 7.6
1.03 1.05 1.05 1.02 1.03 1.03 1.03 1.05
24.9 0.1 0.0 0.0 0.0 10.5 11.3 0.0
26.7 0.1 0.0 0.0 0.0 16.9 17.3 0.0
1.7 .. .. .. .. 2.0 1.8 ..
2.4 .. .. .. .. 0.3 0.4 ..
0.8 0.0 1.0 0.1 2.0 2.7 3.8 0.6
0.5 0.2 0.8 0.2 0.6 2.9 4.0 0.2
60.6 72.5 100.0 100.0 94.2 38.7 18.4 51.4
33.9 .. .. .. .. 16.5 18.9 ..
30.5 .. .. .. .. 92.6 75.3 ..
13.8 .. .. .. .. 5.6 6.4 ..
2.0 .. .. .. .. 7.4 5.9 ..
2.0 .. .. .. .. 6.6 5.0 ..
1.05 .. .. .. .. 1.03 1.04 ..
1,189.7 2,485.5 2,262.1 1,145.6
1,276.5 2,662.3 2,716.0 1,675.6
69.4 176.8 228.7 176.9
193.9 215.9 115.9 38.0
0.7 0.7 1.6 2.5
0.6 0.7 1.3 2.4
81.6 61.4 38.3 34.5
40.2 34.2 26.5 19.5
26.1 28.7 44.6 72.6
25.7 12.9 8.1 6.0
1.7 1.8 3.0 5.3
1.8 1.8 2.6 4.6
1.05 1.06 1.05 1.04
366.0 2,035.9 233.4 611.3 1,749.0 888.2 898.4 T
481.3 2,211.9 251.0 711.1 2,085.5 1,348.9 1,287.0 T
43.9 149.2 18.9 53.6 175.1 146.6 132.1 T
15.4 160.7 21.2 44.0 89.6 27.6 31.7 T
2.2 0.8 0.4 1.3 1.6 2.6 2.4 T
2.0 0.8 0.7 1.1 1.3 2.7 2.3 T
57.8 50.8 60.5 79.5 33.4 37.4 29.4 T
24.6 33.7 32.2 29.0 26.4 18.5 19.9 T
50.8 29.5 33.4 39.4 44.2 78.9 69.1 T
6.8 11.8 13.4 11.4 8.1 5.8 6.2 T
3.6 1.8 2.0 2.5 3.1 5.7 4.9 T
3.2 1.9 2.0 2.2 2.6 5.1 4.2 T
1.05 1.05 1.07 1.05 1.06 1.03 1.04
Small island developing states World
54.3
63.4
5.4
3.7
1.3
1.1
53.0
27.9
45.4
11.0
3.1
2.7
1.06
7,162.1 T
8,424.9 T
659.0 T
570.5 T
1.2 T
1.1 T
53.0 T
29.6 T
39.5 T
12.5 T
2.6 T
2.5 T
1.07
NOTES
k Includes Nagorno-Karabakh.
a Because data are based on national definitions of what constitutes a city or metropolitan area, cross-country comparisons should be made with caution.
l Includes Kosovo.
b The natural sex ratio at birth is commonly assumed and empirically confirmed to be 1.05 male births to 1 female births. c Projections based on medium-fertility variant. d Includes Svalbard and Jan Mayen Islands.
m Includes Abkhazia and South Ossetia. n Includes East Jerusalem. o Includes Transnistria. p Includes Zanzibar T From original data source. DEFINITIONS
e Includes Christmas Island, Cocos (Keeling) Islands and Norfolk Island.
Population: De facto population in a country, area or region as of 1 July.
f Includes Åland Islands.
Population under age 5: De facto population in a country, area or region under age 5 as of 1 July.
g Includes Canary Islands, Ceuta and Melilla. h Includes Northern Cyprus. i Includes Sabah and Sarawak. j Includes Agalega, Rodrigues and Saint Brandon.
Population ages 65 and older: De facto population in a country, area or region ages 65 and older as of 1 July.
Population average annual growth rate: Average annual exponential growth rate for the period specified. Urban population: De facto population living in areas classified as urban according to the criteria used by each country or area as of July 1. Median age: Age that divides the population distribution into two equal parts—that is, 50 percent of the population is above that age and 50 percent is below it. Young age dependency ratio: Ratio of the population ages 0–14 to the population ages 15–64, expressed as the number of dependants per 100 persons of working age (ages 15–64).
expressed as the number of dependants per 100 people of working age (ages 15–64). Total fertility rate: Number of children that would be born to a woman if she were to live to the end of her child-bearing years and bear children at each age in accordance with prevailing age-specific fertility rates. Sex ratio at birth: Number of male births per female birth. MAIN DATA SOURCES Columns 1–6 and 8–13: UNDESA 2013a. Column 7: UNDESA 2013b.
Old age dependency ratio: Ratio of the population ages 65 and older to the population ages 15–64,
TABLE
15
TABLE 15 Population trends | 219