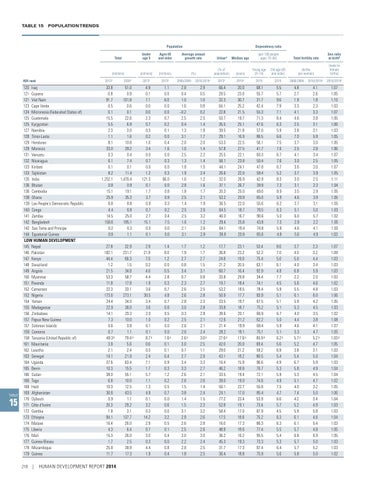
TABLE 15 POPULATION TRENDS
Population
HDI rank
TABLE
15
120 Iraq 121 Guyana 121 Viet Nam 123 Cape Verde 124 Micronesia (Federated States of) 125 Guatemala 125 Kyrgyzstan 127 Namibia 128 Timor-Leste 129 Honduras 129 Morocco 131 Vanuatu 132 Nicaragua 133 Kiribati 133 Tajikistan 135 India 136 Bhutan 136 Cambodia 138 Ghana 139 Lao People's Democratic Republic 140 Congo 141 Zambia 142 Bangladesh 142 Sao Tome and Principe 144 Equatorial Guinea LOW HUMAN DEVELOPMENT 145 Nepal 146 Pakistan 147 Kenya 148 Swaziland 149 Angola 150 Myanmar 151 Rwanda 152 Cameroon 152 Nigeria 154 Yemen 155 Madagascar 156 Zimbabwe 157 Papua New Guinea 157 Solomon Islands 159 Comoros 159 Tanzania (United Republic of) 161 Mauritania 162 Lesotho 163 Senegal 164 Uganda 165 Benin 166 Sudan 166 Togo 168 Haiti 169 Afghanistan 170 Djibouti 171 Côte d'Ivoire 172 Gambia 173 Ethiopia 174 Malawi 175 Liberia 176 Mali 177 Guinea-Bissau 178 Mozambique 179 Guinea
218
Dependency ratio
Total
Under age 5
Ages 65 and older
Average annual growth rate
Urbana
Median age
(millions)
(millions)
(millions)
(%)
(% of population)
(years)
Young age (0–14)
Old age (65 and older)
2010/2015c
2013c
2015c
2015
2015
2000/2005
2010/2015c
2010/2015c
2.9 0.5 1.0 0.8 0.2 2.5 1.4 1.9 1.7 2.0 1.4 2.2 1.4 1.5 2.4 1.2 1.6 1.7 2.1 1.9 2.6 3.2 1.2 2.6 2.8
66.4 28.5 32.3 64.1 22.8 50.7 35.5 39.5 29.1 53.3 57.8 25.5 58.1 44.1 26.6 32.0 37.1 20.3 53.2 36.5 64.5 40.0 29.4 64.1 39.8
20.0 23.0 30.7 25.2 21.5 19.7 25.1 21.8 16.9 22.5 27.5 22.1 23.8 24.1 22.0 26.9 26.7 25.0 20.9 22.0 18.7 16.7 25.8 19.4 20.9
68.1 55.7 31.7 42.4 55.3 71.3 47.6 57.0 86.5 56.1 41.7 60.3 50.4 47.8 59.4 42.9 39.9 49.0 65.0 55.6 78.5 90.6 43.8 74.8 65.6
5.5 5.7 9.6 7.9 7.1 8.4 6.3 5.9 6.6 7.5 7.6 6.7 7.6 6.7 5.2 8.3 7.3 8.9 5.9 6.2 6.3 5.0 7.3 5.8 4.8
4.8 2.7 1.9 3.3 4.1 4.6 2.5 3.8 7.0 3.7 2.5 4.1 3.0 3.6 3.7 3.0 3.1 3.5 4.6 3.7 5.1 6.0 2.9 4.6 5.6
4.1 2.6 1.8 2.3 3.3 3.8 3.1 3.1 5.9 3.0 2.8 3.4 2.5 3.0 3.9 2.5 2.3 2.9 3.9 3.1 5.0 5.7 2.2 4.1 4.9
1.07 1.05 1.10 1.03 1.07 1.05 1.06 1.03 1.05 1.05 1.06 1.07 1.05 1.07 1.05 1.11 1.04 1.05 1.05 1.05 1.03 1.02 1.05 1.03 1.03
1.2 1.7 2.7 1.5 3.1 0.8 2.7 2.5 2.8 2.3 2.8 2.8 2.1 2.1 2.4 3.0 p 2.5 1.1 2.9 3.3 2.7 2.1 2.6 1.4 2.4 1.5 2.3 3.2 2.6 2.8 2.6 3.0 2.4 2.5 2.5
17.7 36.8 24.8 21.2 60.7 33.8 19.7 53.2 50.9 33.5 33.8 39.6 12.6 21.4 28.2 27.6 p 42.0 29.0 43.1 16.4 46.2 33.5 39.0 56.1 24.1 77.2 52.8 58.4 17.5 16.0 48.9 36.2 45.3 31.7 36.4
23.1 23.2 19.0 20.5 16.4 29.8 18.4 18.5 17.7 19.7 18.7 20.1 21.2 19.9 19.1 17.6 p 20.0 21.2 18.2 15.9 18.6 19.4 19.0 22.7 17.0 23.4 19.1 17.0 18.6 17.3 18.6 16.2 19.3 17.3 18.8
53.4 52.3 75.4 63.1 92.9 34.4 74.1 78.4 83.9 67.5 75.2 66.9 62.2 69.4 75.1 85.9 p 69.4 59.2 80.5 96.6 76.7 72.1 74.6 55.8 85.4 53.9 73.4 87.9 75.2 86.3 77.4 95.5 73.3 87.4 75.9
8.6 7.0 5.0 6.1 4.8 7.7 4.5 5.9 5.1 5.1 5.1 6.7 5.0 5.9 5.1 6.2 p 5.6 6.9 5.4 4.9 5.3 5.9 4.9 7.5 4.7 6.6 5.7 4.5 6.3 6.3 5.5 5.4 5.3 6.4 5.6
3.7 4.0 5.0 4.0 6.8 2.2 5.6 5.5 6.1 5.9 5.3 4.0 4.4 4.6 5.3 5.7 p 5.2 3.8 5.4 6.7 5.8 5.3 5.1 4.0 7.4 4.2 5.2 5.9 6.1 6.1 5.7 6.8 5.7 5.7 5.8
2.3 3.2 4.4 3.4 5.9 2.0 4.6 4.8 6.0 4.2 4.5 3.5 3.8 4.1 4.7 5.2 p 4.7 3.1 5.0 5.9 4.9 4.5 4.7 3.2 5.0 3.4 4.9 5.8 4.6 5.4 4.8 6.9 5.0 5.2 5.0
1.07 1.09 1.03 1.03 1.03 1.03 1.02 1.03 1.06 1.05 1.03 1.02 1.08 1.07 1.05 1.03 p 1.05 1.03 1.04 1.03 1.04 1.04 1.02 1.05 1.06 1.04 1.03 1.03 1.04 1.03 1.05 1.05 1.03 1.03 1.02
2013c
2030c
2013c
2013c
33.8 0.8 91.7 0.5 0.1 15.5 5.5 2.3 1.1 8.1 33.0 0.3 6.1 0.1 8.2 1,252.1 0.8 15.1 25.9 6.8 4.4 14.5 156.6 0.2 0.8
51.0 0.9 101.8 0.6 0.1 22.6 6.9 3.0 1.6 10.8 39.2 0.4 7.4 0.1 11.4 1,476.4 0.9 19.1 35.3 8.8 6.8 25.0 185.1 0.3 1.1
4.9 0.1 7.1 0.0 0.0 2.3 0.7 0.3 0.2 1.0 3.4 0.0 0.7 0.0 1.2 121.3 0.1 1.7 3.7 0.9 0.7 2.7 15.1 0.0 0.1
1.1 0.0 6.0 0.0 0.0 0.7 0.2 0.1 0.0 0.4 1.6 0.0 0.3 0.0 0.3 66.0 0.0 0.8 0.9 0.3 0.2 0.4 7.5 0.0 0.0
27.8 182.1 44.4 1.2 21.5 53.3 11.8 22.3 173.6 24.4 22.9 14.1 7.3 0.6 0.7 49.3 p 3.9 2.1 14.1 37.6 10.3 38.0 6.8 10.3 30.6 0.9 20.3 1.8 94.1 16.4 4.3 15.3 1.7 25.8 11.7
| HUMAN DEVELOPMENT REPORT 2014
32.9 231.7 66.3 1.5 34.8 58.7 17.8 33.1 273.1 34.0 36.0 20.3 10.0 0.8 1.1 79.4 p 5.6 2.4 21.9 63.4 15.5 55.1 10.0 12.5 43.5 1.1 29.2 3.1 137.7 26.0 6.4 26.0 2.5 38.9 17.3
2.9 21.8 7.0 0.2 4.0 4.4 1.9 3.6 30.5 3.4 3.6 2.0 1.0 0.1 0.1 8.7 p 0.6 0.3 2.4 7.1 1.7 5.7 1.1 1.3 4.9 0.1 3.2 0.3 14.2 2.9 0.7 3.0 0.3 4.4 1.9
1.4 8.0 1.2 0.0 0.5 2.8 0.3 0.7 4.8 0.7 0.6 0.5 0.2 0.0 0.0 1.6 p 0.1 0.1 0.4 0.9 0.3 1.2 0.2 0.5 0.7 0.0 0.6 0.0 3.2 0.5 0.1 0.4 0.0 0.8 0.4
2000/2005
2.8 0.4 1.0 1.6 –0.2 2.5 0.4 1.3 3.1 2.0 1.0 2.5 1.3 1.8 1.9 1.6 2.8 1.8 2.5 1.4 2.5 2.5 1.6 2.1 3.1 1.7 1.9 2.7 0.8 3.4 0.7 2.3 2.6 2.6 2.8 3.0 0.3 2.5 2.6 2.6 2.6 p 3.0 0.7 2.7 3.4 3.3 2.6 2.6 1.5 3.8 1.4 1.5 3.1 2.9 2.6 2.5 3.0 2.2 2.8 1.8
(per 100 people ages 15–64)
Total fertility rate
Sex ratio at birthb
(births per woman)
(male to female births)