HUMAN DEVELOPMENT REPORT 2014 Sustaining Human Progress Reducing Vulnerabilities and Building Resilience
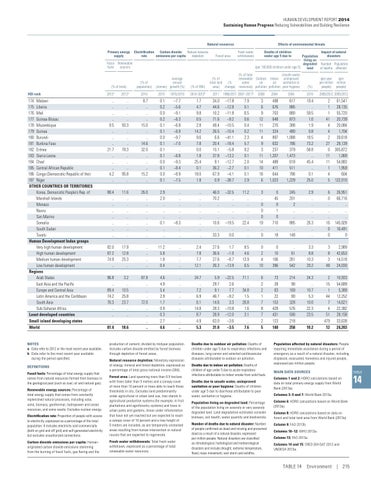
Effects of environmental threats
Natural resources Primary energy supply
Electrification Carbon dioxide Natural resource rate emissions per capita depletion
Forest area
Average annual (tonnes) growth (%)
(% of total land (% area) change)
Fresh water withdrawals
Fossil Renewable fuels sources
(% of population)
(% of total)
(% of GNI)
Deaths of children under age 5 due to
Impact of natural disasters Population living on degraded Number Population (per 100,000 children under age 5) land of deaths affected
(% of total renewable Outdoor Indoor water air air resources) pollution pollution
Unsafe water, unimproved sanitation or poor hygiene
(%)
(per year (per per million million people) people) 2005/2012 2005/2012
HDI rank
2012a
2012a
2010
2010
1970/2010
2010–2012b
2011
2008
2004
2004
2010
174 Malawi 175 Liberia 176 Mali 177 Guinea-Bissau 178 Mozambique 179 Guinea 180 Burundi 181 Burkina Faso 182 Eritrea 183 Sierra Leone 184 Chad 185 Central African Republic 186 Congo (Democratic Republic of the) 187 Niger OTHER COUNTRIES OR TERRITORIES Korea, Democratic People’s Rep. of Marshall Islands Monaco Nauru San Marino Somalia South Sudan Tuvalu Human Development Index groups Very high human development High human development Medium human development Low human development Regions Arab States East Asia and the Pacific Europe and Central Asia Latin America and the Caribbean South Asia Sub-Saharan Africa Least developed countries
.. .. .. .. 9.5 .. .. .. 21.7 .. .. .. 4.2 ..
.. .. .. .. 93.3 .. .. .. 78.3 .. .. .. 95.8 ..
8.7 .. .. .. 15.0 .. .. 14.6 32.0 .. .. .. 15.2 ..
0.1 0.2 0.0 0.2 0.1 0.1 0.0 0.1 0.1 0.1 0.0 0.1 0.0 0.1
–7.7 –5.6 –9.1 –6.3 –6.8 –6.9 –9.7 –7.0 .. –6.8 –9.3 –8.4 –8.9 –7.5
1.7 4.7 9.8 0.5 2.8 14.2 9.6 7.8 0.0 1.8 25.4 0.1 18.0 1.8
34.0 44.6 10.2 71.6 49.4 26.5 6.6 20.4 15.1 37.8 9.1 36.2 67.9 0.9
–17.8 –12.8 –11.8 –9.2 –10.5 –10.4 –41.1 –18.4 –5.8 –13.2 –12.7 –2.7 –4.1 –38.7
7.9 0.1 6.5 0.6 0.4 0.2 2.3 5.7 9.2 0.1 2.0 0.1 0.1 2.9
3 6 9 12 11 11 4 9 3 11 14 10 16 6
498 676 703 648 270 324 897 632 237 1,207 488 411 644 1,023
617 885 880 873 388 480 1,088 786 379 1,473 618 511 786 1,229
19.4 .. 59.5 1.0 1.9 0.8 18.5 73.2 58.8 .. 45.4 .. 0.1 25.0
2 1 1 41 4 4 2 27 0 11 11 1 4 5
61,541 28,135 55,720 20,739 20,084 1,704 39,618 28,139 305,872 1,069 54,883 1,959 604 122,010
88.4 .. .. .. .. .. .. ..
11.6 .. .. .. .. .. .. ..
26.0 .. .. .. .. .. .. ..
2.9 2.0 .. .. .. 0.1 .. ..
.. .. .. .. .. –8.3 .. ..
.. .. .. .. .. .. .. ..
46.0 70.2 .. .. .. 10.6 .. 33.3
–32.5 .. .. .. .. –19.5 .. 0.0
11.2 .. .. .. .. 22.4 .. ..
3 .. 0 0 0 19 .. 0
0 45 0 1 0 710 .. 18
245 201 2 .. .. 885 .. 148
2.9 .. .. .. .. 26.3 .. ..
6 0 .. .. .. 16 0 0
26,951 66,716 .. .. .. 145,928 16,491 0
82.0 87.2 74.9 ..
17.9 12.8 25.3 ..
.. .. .. ..
11.2 5.8 1.8 0.4
.. .. .. ..
2.4 7.8 7.7 12.1
27.6 36.6 27.6 26.3
1.7 –1.0 –8.7 –13.9
8.5 4.6 13.9 6.5
0 2 4 10
0 10 106 396
.. 61 261 542
3.3 8.8 10.3 20.2
3 8 3 48
2,989 42,653 14,518 24,030
96.8 .. 89.4 74.2 76.3 .. ..
3.2 .. 10.5 25.8 23.7 .. ..
87.8 .. .. .. 72.0 .. ..
4.6 4.9 5.4 2.9 1.7 0.9 0.3
.. .. .. .. .. .. ..
24.7 .. 7.2 6.9 6.1 14.8 8.7
5.9 29.7 9.1 46.7 14.6 28.3 28.9
–22.5 2.6 7.7 –9.2 3.3 –10.8 –12.0
71.1 .. 34.8 1.5 26.8 1.6 3.1
6 2 2 1 7 8 7
73 28 63 22 153 428 431
214 90 169 80 328 576 590
24.3 .. 10.7 5.3 10.0 22.3 23.5
2 15 1 44 7 4 51
10,933 54,689 5,389 12,252 14,621 22,382 28,158
Small island developing states World
NOTES a Data refer to 2012 or the most recent year available. b Data refer to the most recent year available during the period specified. DEFINITIONS Fossil fuels: Percentage of total energy supply that comes from natural resources formed from biomass in the geological past (such as coal, oil and natural gas).
..
..
..
2.7
..
4.9
63.0
–3.6
..
2
123
218
..
479
33,638
81.4
18.6
..
4.6
..
5.3
31.0
–3.5
7.6
5
140
258
10.2
12
24,203
production of cement, divided by midyear population. Includes carbon dioxide emitted by forest biomass through depletion of forest areas. Natural resource depletion: Monetary expression of energy, mineral and forest depletion, expressed as a percentage of total gross national income (GNI).
Electrification rate: Proportion of people with access to electricity, expressed as a percentage of the total population. It includes electricity sold commercially (both on grid and off grid) and self-generated electricity but excludes unauthorized connections.
Forest area: Land spanning more than 0.5 hectare with trees taller than 5 metres and a canopy cover of more than 10 percent or trees able to reach these thresholds in situ. Excludes land predominantly under agricultural or urban land use, tree stands in agricultural production systems (for example, in fruit plantations and agroforestry systems) and trees in urban parks and gardens. Areas under reforestation that have not yet reached but are expected to reach a canopy cover of 10 percent and a tree height of 5 meters are included, as are temporarily unstocked areas resulting from human intervention or natural causes that are expected to regenerate.
Carbon dioxide emissions per capita: Humanoriginated carbon dioxide emissions stemming from the burning of fossil fuels, gas flaring and the
Fresh water withdrawals: Total fresh water withdrawn, expressed as a percentage of total renewable water resources.
Renewable energy sources: Percentage of total energy supply that comes from constantly replenished natural processes, including solar, wind, biomass, geothermal, hydropower and ocean resources, and some waste. Excludes nuclear energy.
1990/2011 2007–2011b
Deaths due to outdoor air pollution: Deaths of children under age 5 due to respiratory infections and diseases, lung cancer and selected cardiovascular diseases attributable to outdoor air pollution. Deaths due to indoor air pollution: Deaths of children of age under 5 due to acute respiratory infections attributable to indoor smoke from solid fuels. Deaths due to unsafe water, unimproved sanitation or poor hygiene: Deaths of children under age 5 due to diarrhoea attributable to poor water, sanitation or hygiene.
Population affected by natural disasters: People requiring immediate assistance during a period of emergency as a result of a natural disaster, including displaced, evacuated, homeless and injured people, expressed per million people. MAIN DATA SOURCES Columns 1 and 2: HDRO calculations based on data on total primary energy supply from World Bank (2013a). Columns 3–5 and 7: World Bank 2013a.
Population living on degraded land: Percentage of the population living on severely or very severely degraded land. Land degradation estimates consider biomass, soil health, water quantity and biodiversity.
Column 6: HDRO calculations based on World Bank (2013a).
Number of deaths due to natural disaster: Number of people confirmed as dead and missing and presumed dead as a result of a natural disaster, expressed per million people. Natural disasters are classified as climatological, hydrological and meteorological disasters and include drought, extreme temperature, flood, mass movement, wet storm and wildfire.
Column 9: FAO 2013b.
Column 8: HDRO calculations based on data on forest and total land area from World Bank (2013a) Columns 10–12: WHO 2013a. Column 13: FAO 2013a. Columns 14 and 15: CRED EM-DAT 2013 and UNDESA 2013a.
TABLE 14 Environment | 215
TABLE
14