HUMAN DEVELOPMENT REPORT 2014 Sustaining Human Progress Reducing Vulnerabilities and Building Resilience
Trade
Financial flows
Foreign direct International investment, net inflows trade Remoteness
Private capital flows
Human mobility
Net official development Total assistance Remittances, reserves receiveda minus gold inflows
Communication
Net migration rate
Stock of immigrants
International inbound tourists
Internet users
International telephone traffic (minutes per person)
(kilometres)
(% of GDP)
(% of GDP)
(% of GDP)
(% of GNI)
(% of GDP)
(% of GDP)
(per 1,000 people)
(% of population)
(thousands)
(% of population)
2012
2012b
2012b
2012b
2011
2011c
2012b
2010/2015d
2013
2011
2012
8,103 10,596 8,264 9,017 7,930 7,842 8,304 7,888 8,423 9,216 7,825
.. 75.7 78.4 47.0 49.7 37.5 69.9 66.2 35.6 146.3 76.5
2.0 16.5 18.8 0.1 0.1 0.7 24.3 17.5 5.0 10.2 16.8
–2.6 –36.0 –22.9 .. 1.8 .. –25.5 .. .. .. –18.9
12.3 16.3 4.5 1.0 0.3 6.3 14.6 4.9 0.5 38.4 10.9
4.74 1.25 1.27 1.93 1.06 .. 2.00 .. .. 0.73 1.69
1.5 .. .. 7.0 3.3 0.1 0.8 0.7 4.7 0.9 2.8
–1.2 –0.2 –0.2 –0.4 –1.5 1.8 –0.7 –1.9 0.4 –0.2 –0.3
1.1 0.8 3.2 2.5 4.1 0.2 1.6 3.4 2.9 0.7 0.7
30 1,718 30 142 238 107 52 71 54 186 82
2.9 4.8 1.5 1.2 3.7 0.8 1.3 2.1 3.0 1.7 1.4
.. 5.8 .. .. .. 47.5 .. .. .. 4.1 ..
.. 10,788 .. .. 5,958 .. .. 11,948
.. .. .. .. .. .. 94.2 ..
.. 4.2 .. .. .. .. .. 5.0
.. .. .. .. .. .. .. ..
.. 38.2 .. .. .. .. .. 76.9
.. .. .. .. .. .. .. ..
0.1 1.3 .. .. 0.5 .. 2.3 6.7
0.0 .. .. .. .. –2.9 15.7 ..
0.2 3.2 64.2 20.6 15.4 0.2 5.6 1.5
.. 5 295 .. 156 .. .. 1
.. 10.0 87.0 .. 50.9 1.4 .. 35.0
.. .. .. .. .. .. .. ..
7,825 8,536 8,741 8,360
63.1 60.0 63.3 66.1
1.9 2.8 2.2 2.5
0.4 –3.0 –1.9 ..
–0.3 0.1 0.5 5.1
0.26 0.82 3.67 5.03
.. .. 2.7 2.4
2.5 –0.1 –0.9 –0.8
12.5 1.8 0.7 1.6
581,506 282,225 84,432 19,970
77.1 42.5 17.6 12.3
.. 21.2 .. ..
174.8 13.1 .. 10.3
7,037 8,809 6,364 10,621 7,845 9,496 8,646
91.9 66.2 77.0 45.8 53.5 76.9 74.3
1.5 3.0 3.6 3.1 1.4 3.3 3.2
1.0 .. –4.5 –3.8 –1.1 .. ..
.. 0.1 0.5 0.3 0.6 3.8 6.9
.. 0.93 2.06 1.11 3.57 2.73 4.67
1.3 0.9 .. 1.5 2.7 2.2 2.4
0.4 –0.3 –0.6 –1.0 –0.9 –0.1 –1.1
8.3 0.4 6.7 1.3 0.9 1.8 1.2
71,884 125,944 74,011 70,256 13,462 30,695 18,701
34.2 36.7 41.1 43.4 12.3 15.2 6.8
92.0 .. 79.3 39.9 34.1 .. ..
106.3 .. 34.1 25.4 .. 9.7 ..
Small island developing states
9,133
69.2
2.5
–9.6
3.3
5.79
..
–2.8
1.9
16,456
25.1
..
..
World
8,078
62.4
2.2
–0.7
0.1
0.71
2.9
0.0
3.2
968,591
35.5
..
42.4
HDI rank
177 Guinea-Bissau 178 Mozambique 179 Guinea 180 Burundi 181 Burkina Faso 182 Eritrea 183 Sierra Leone 184 Chad 185 Central African Republic 186 Congo (Democratic Republic of the) 187 Niger OTHER COUNTRIES OR TERRITORIES Korea, Democratic People’s Rep. of Marshall Islands Monaco Nauru San Marino Somalia South Sudan Tuvalu Human Development Index groups Very high human development High human development Medium human development Low human development Regions Arab States East Asia and the Pacific Europe and Central Asia Latin America and the Caribbean South Asia Sub-Saharan Africa Least developed countries
NOTES
DEFINITIONS
a A negative value refers to net official development assistance disbursed by donor countries.
Remoteness: GDP-weighted average distance from world markets, calculated as the sum of all bilateral distance between the capitals of one country and all others, weighted by the partner country’s share in world GDP.
b Data refer to 2012 or the most recent year available. c Data refer to 2011 or the most recent year available. d Data are average of annual projected values for 2010–2015. e Data refer to the most recent year available during the period specified. f Includes Svalbard and Jan Mayen Islands. g Includes Christmas Island, Cocos (Keeling) Islands and Norfolk Island. h Includes Canary Islands, Ceuta and Melilla. i Includes Northern Cyprus. j Includes Sabah and Sarawak. k Includes Agalega, Rodrigues and Saint Brandon l Includes Nagorno-Karabakh. m Includes Kosovo. n Excludes Abkhazia and South Ossetia. o Includes East Jerusalem. Refugees are not part of the foreign-born migrant stock in the State of Palestine. p Includes Transnistria.
International trade: A basic indicator of openness to foreign trade and economic integration. It indicates the dependence of domestic producers on foreign demand (exports) and of domestic consumers and producers on foreign supply (imports), relative to the country’s economic size (GDP). Trade is the sum of exports and imports of goods and services measured as a share of gross domestic product. Foreign direct investment, net inflows: Sum of equity capital, reinvestment of earnings, other longterm capital and short-term capital, expressed as a percentage of GDP. Private capital flows: Net foreign direct investment and portfolio investment, expressed as a percentage of GDP. Net official development assistance received: Disbursements of loans made on concessional terms (net of repayments of principal) and grants by official agencies to promote economic development and welfare in countries and territories on the
Incoming
Outgoing
2006–2011e 2006–2011e
.. 13.9 .. .. .. 1.7 .. .. 7.3 5.6 ..
Internet users: Percentage of people with access to the worldwide network.
Development Assistance Committee list of aid recipients, expressed as a percentage of the recipient country’s GNI. Remittances, inflows: Earnings and material resources transferred by international migrants or refugees to recipients in their country of origin or countries in which the migrant formerly resided.
International telephone traffic, incoming: Effective (completed) telephone calls (fixed and mobile) originating outside a given country with a destination inside the country, expressed in minutes of traffic per person.
Total reserves minus gold: Sum of special drawing rights, reserves of International Monetary Fund (IMF) members held by the IMF and holdings of foreign exchange under the control of monetary authorities, excluding gold holdings, expressed as a percentage of GDP.
International telephone traffic, outgoing: Effective (completed) telephone calls (fixed and mobile) originating inside a given country with a destination outside the country, expressed in minutes of traffic per person.
Net migration rate: Ratio of the difference between the number of in-migrants and out-migrants from a country to the average population, expressed per 1,000 people.
Column 1: HDRO calculations based on data on GDP from World Bank (2013a) and data on geo-distance from CEPII (2013).
Stock of immigrants: Ratio of the stock of immigrants into a country, expressed as a percentage of the country’s population. The definition of immigrant varies across countries but generally includes the stock of foreign-born people or the stock of foreign people (according to citizenship) or a combination of the two. International inbound tourists: Arrivals of nonresident visitors (overnight visitors, tourists, same-day visitors, excursionists) at national borders .
MAIN DATA SOURCES
Column 2: HDRO calculations based on data from World Bank (2013a). Columns 3–7, 10 and 11: World Bank 2013a. Column 8: UNDESA 2013a. Column 9: UNDESA 2013c. Columns 12 and 13: HDRO calculations based on data on incoming and outgoing telephone traffic from ITU (2013).
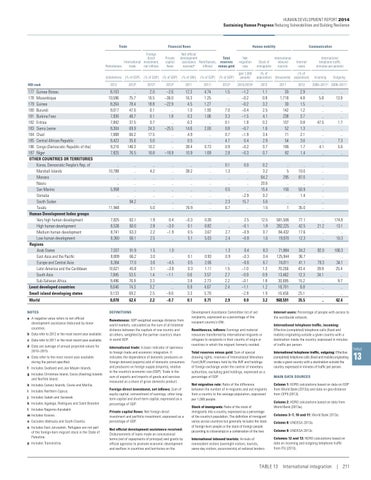
TABLE 13 International integration | 211
TABLE
13